See money and lags for more data. It applies to the US Federal Reserve but the lag concept applies to all central banks, they just differ on the size of the lags.
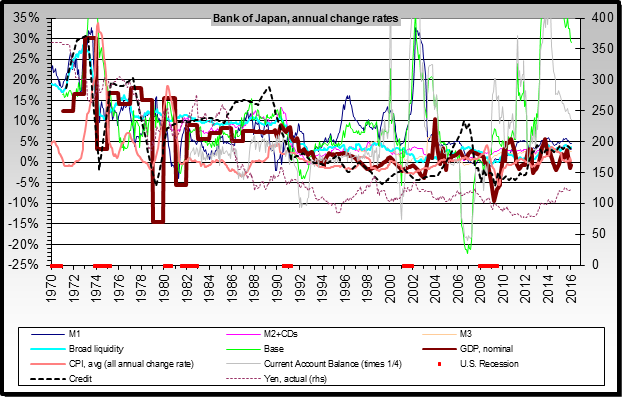
As of mid 2006, 100 million yen is very roughly equal to .865 million US dollars.
Since the minus 100,000 figure on the left scale is in units of 100 million yen, each 100,000 figure equals about 86.5 billion dollars.
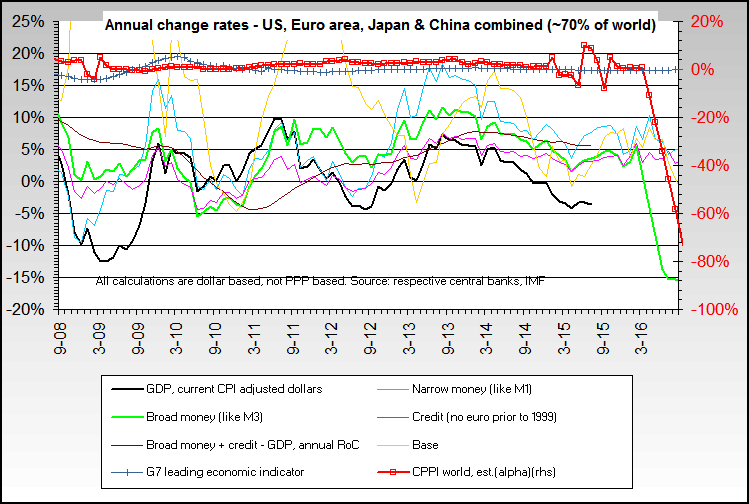
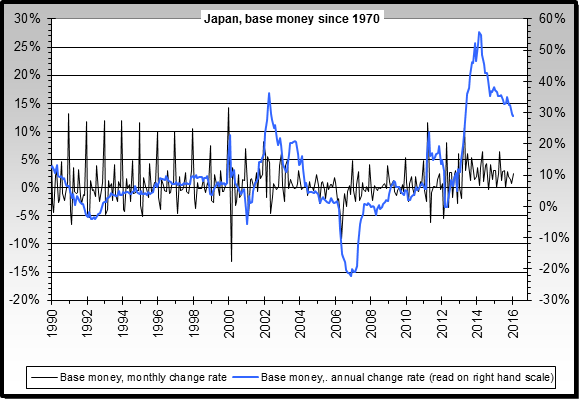
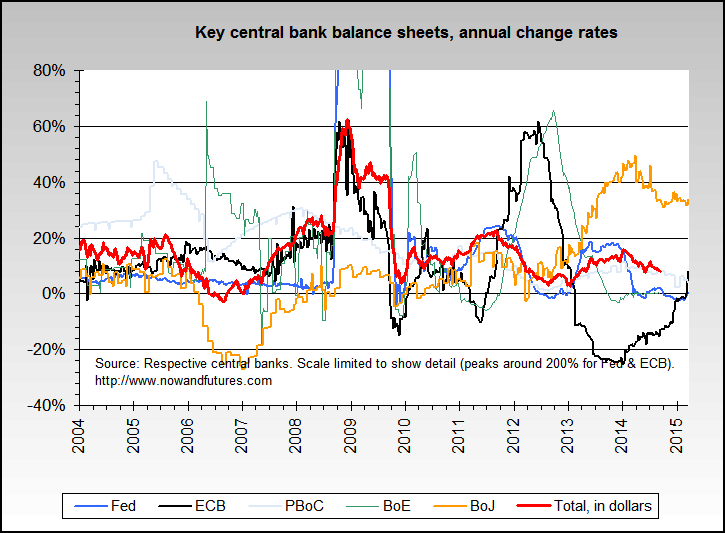
Short term, annual change rates
Source
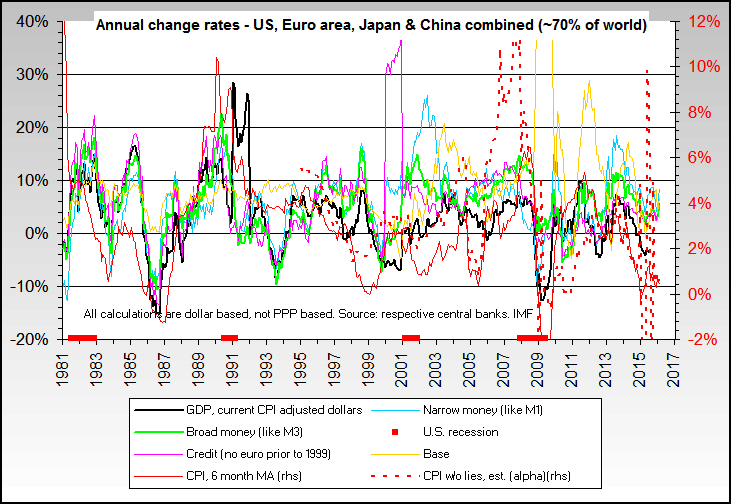
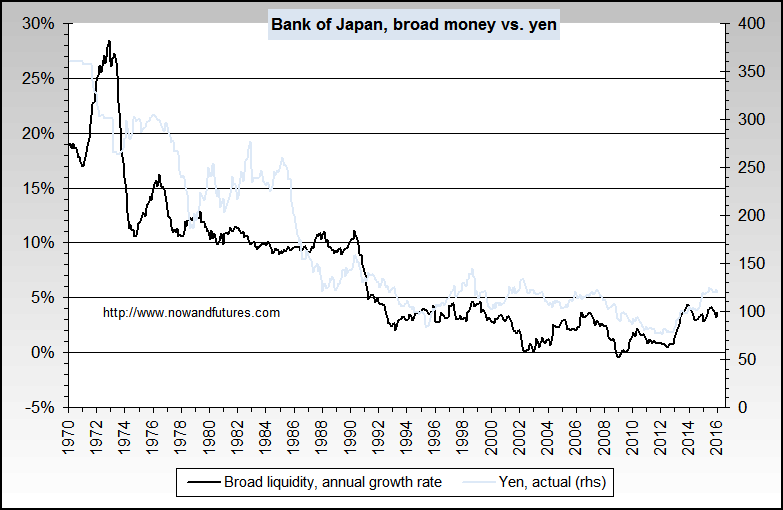
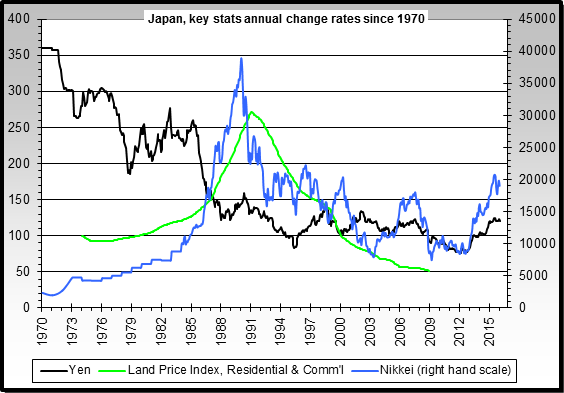
Long term, annual change rates
Source
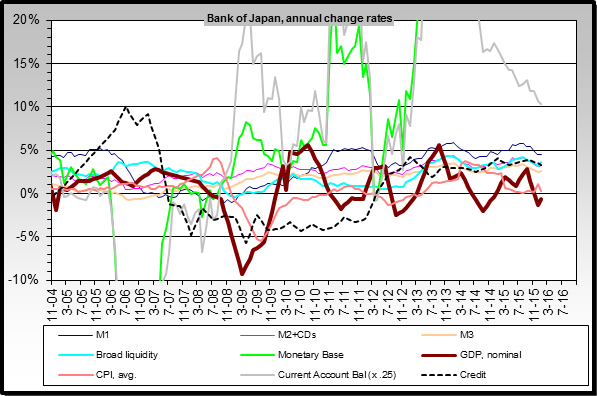
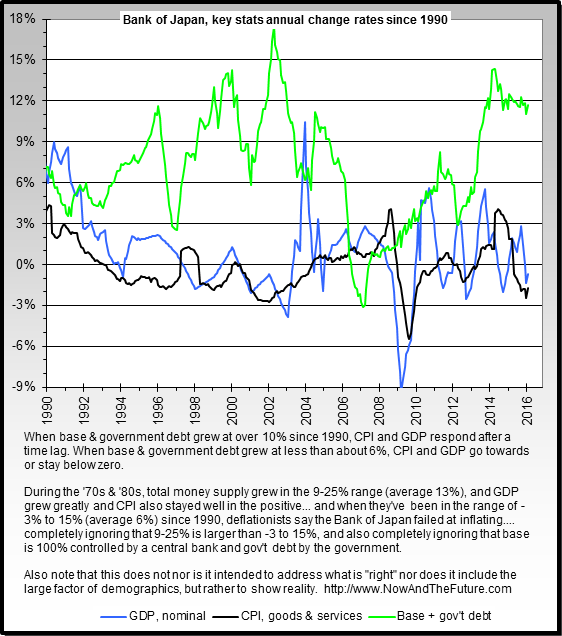
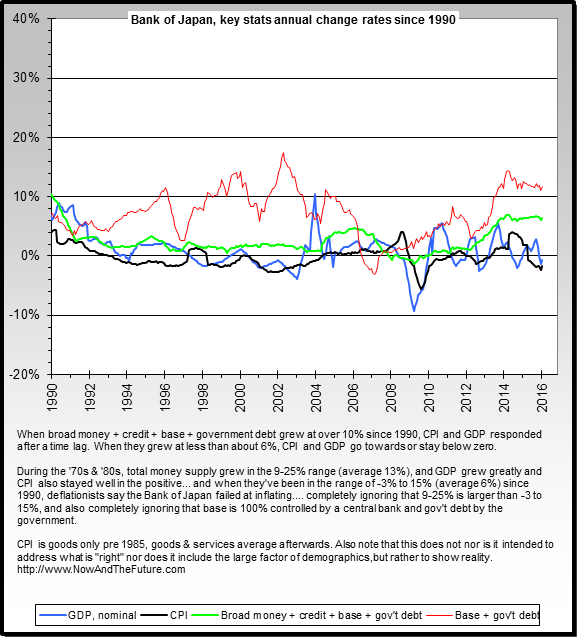
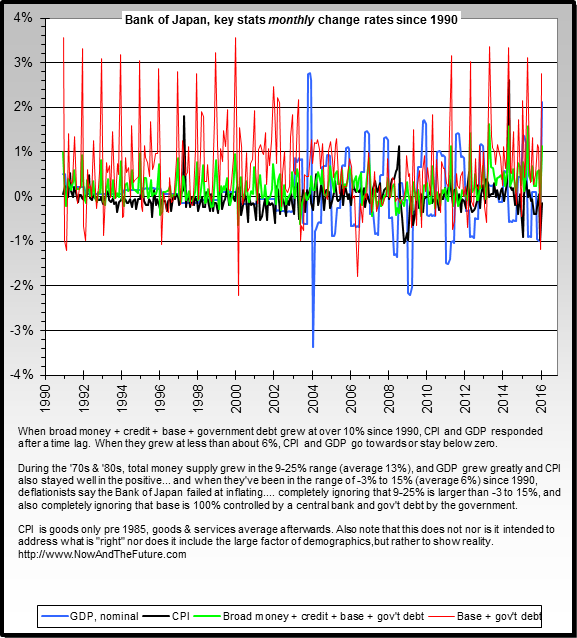
Deflation, debt, monetary base & lags since 1990 in Japan
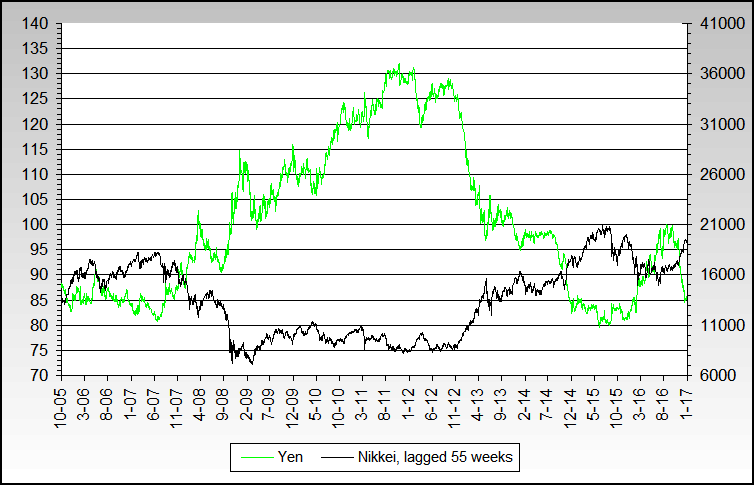
An interesting correlation between the Yen and the Nikkei
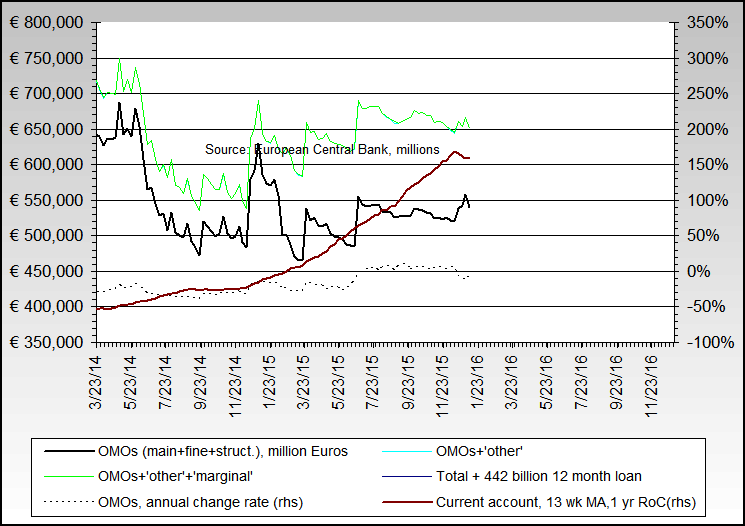
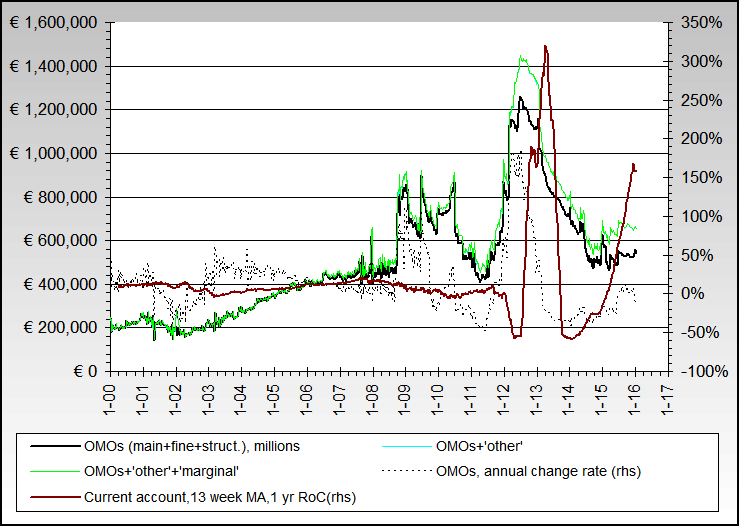
Click here for a general high level picture of ECB Open Market Operations, and here for the main ECB OMO definitions and background page.
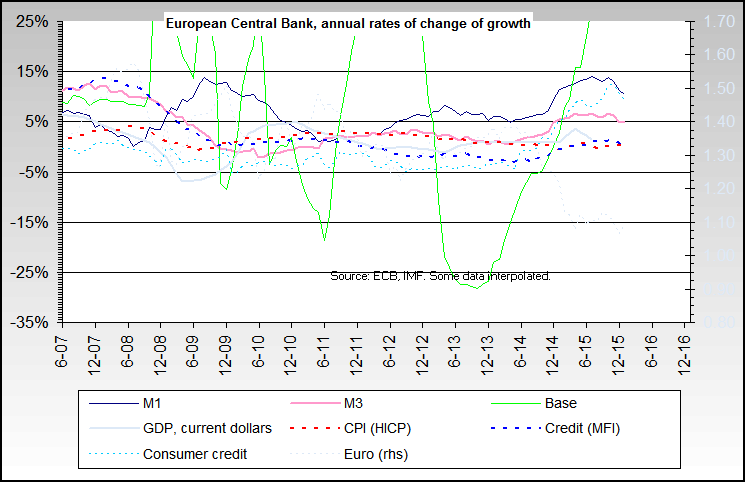
Short term, annual change rates
Long term, annual change rates
Source
See money and lags for more data. It applies to the US Federal Reserve but the lag concept applies to all central banks, they just differ on the size of the lags.
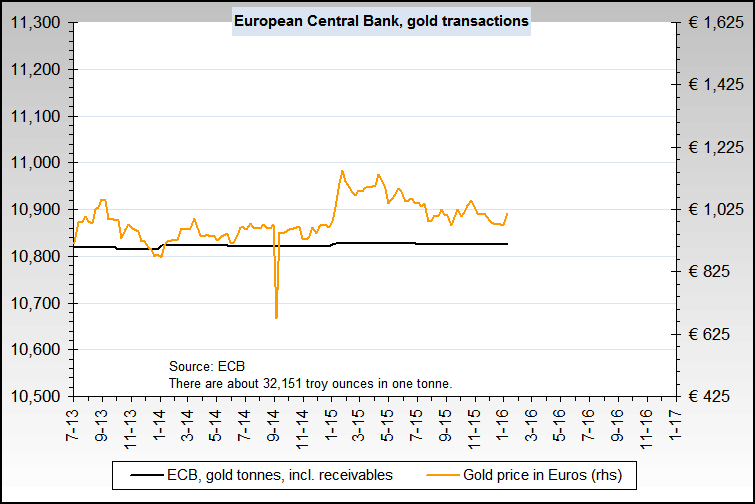
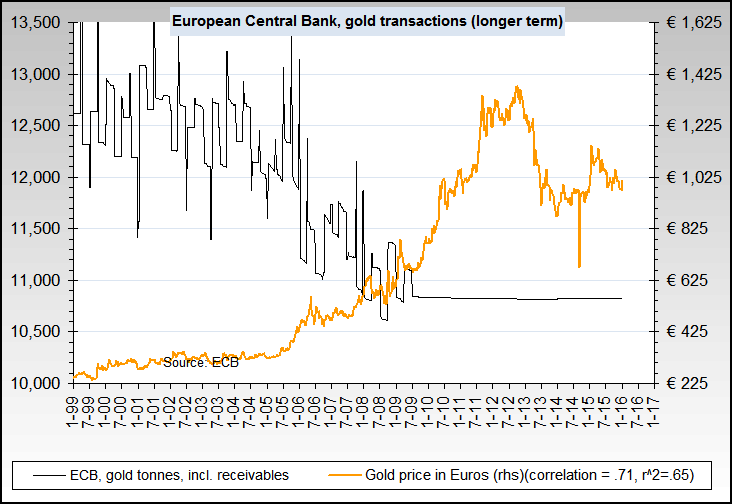
ECB gold buying & selling, short term
ECB gold buying & selling, long term
Source, weekly source
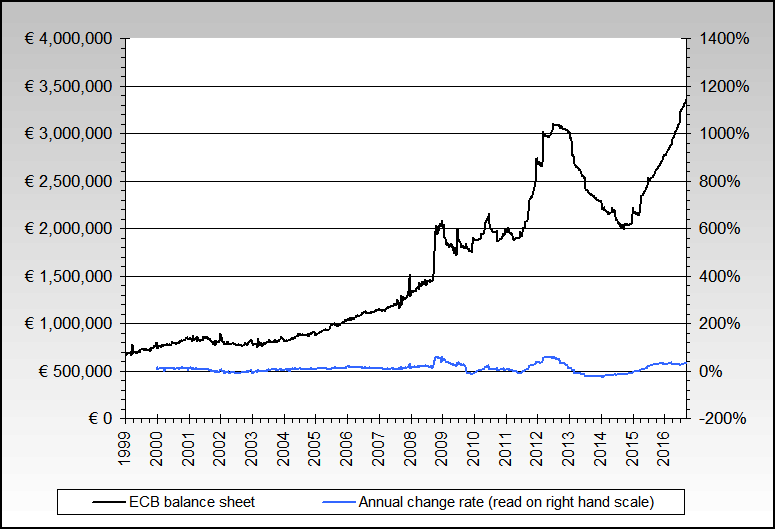
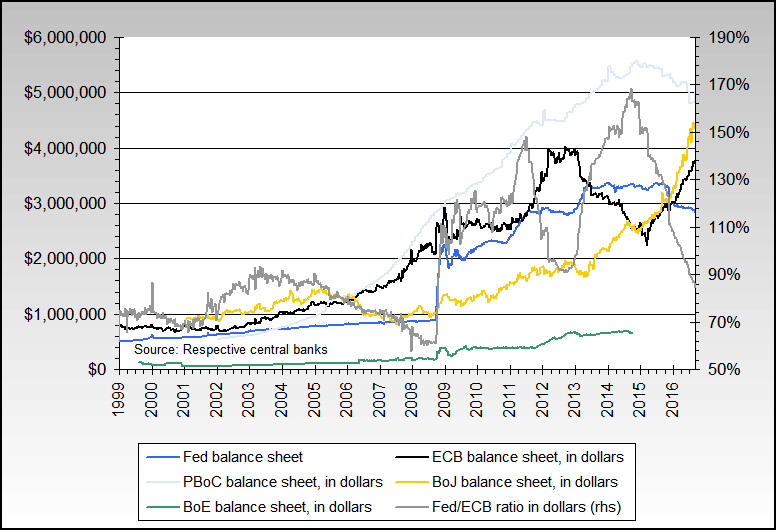
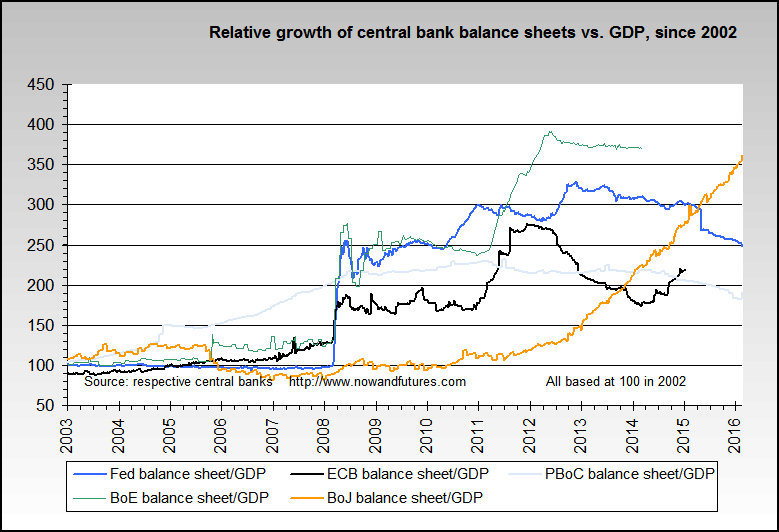
ECB balance sheet
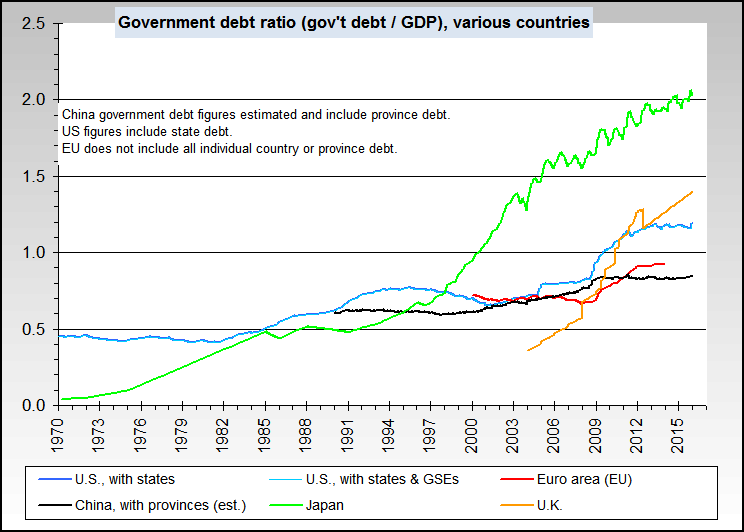
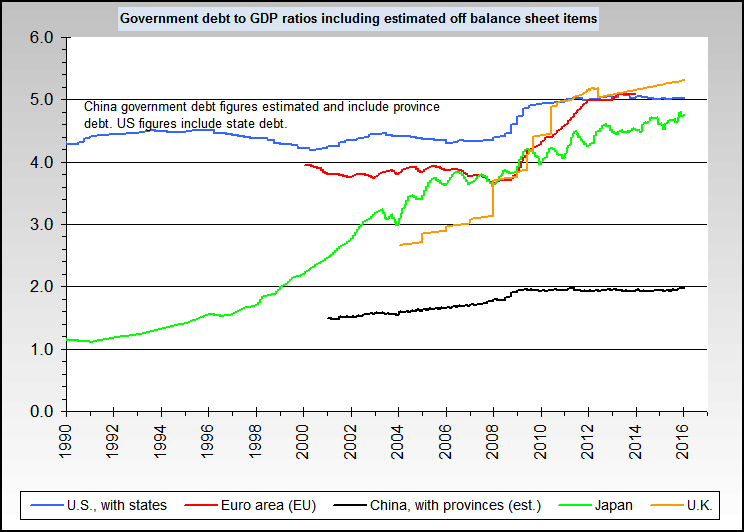
Click here for a picture of ECB debt in the Euro area.
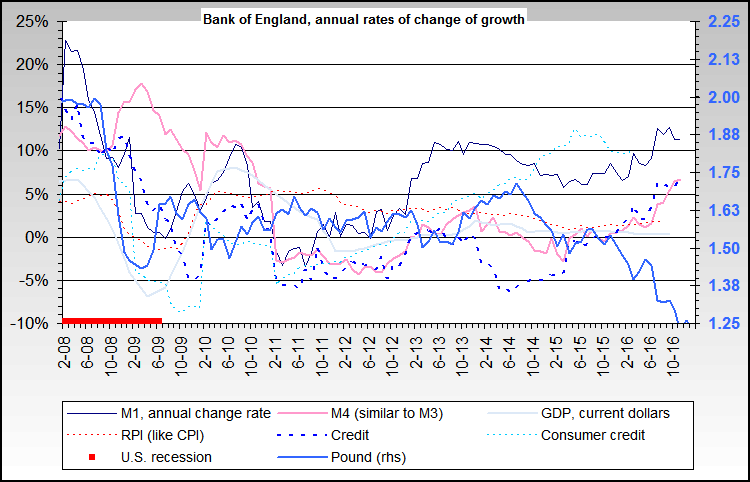
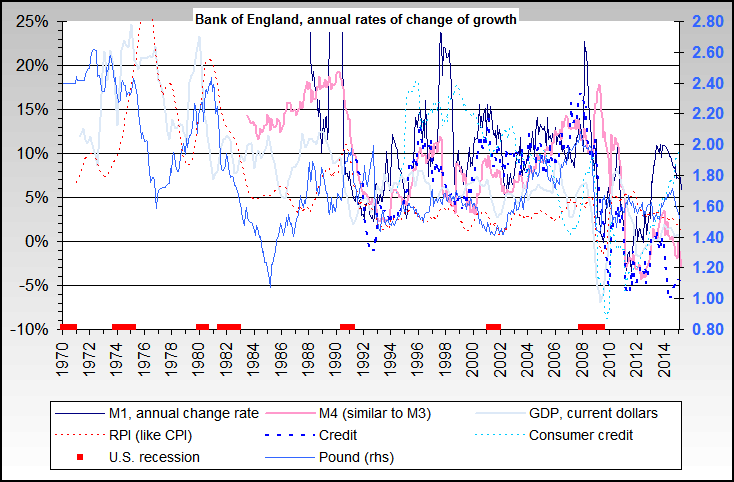
Bank of England
Short term, annual change rates
Long term, annual change rates
Source
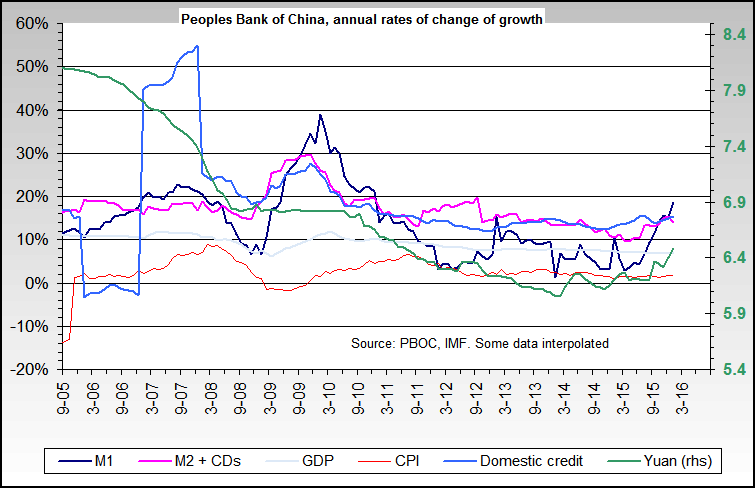
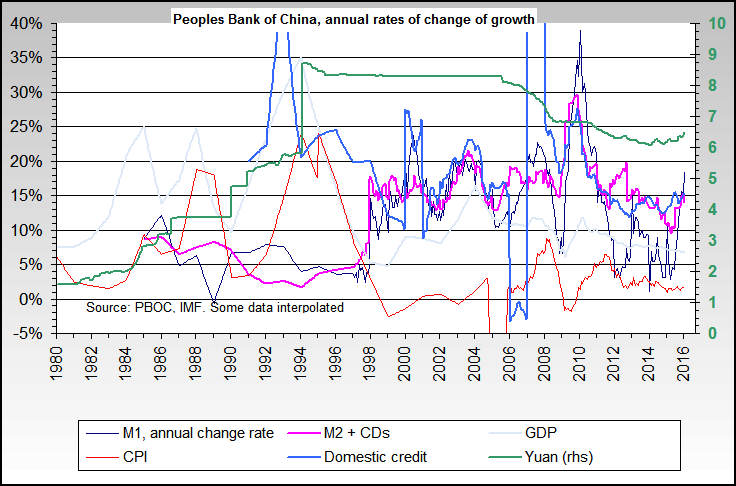
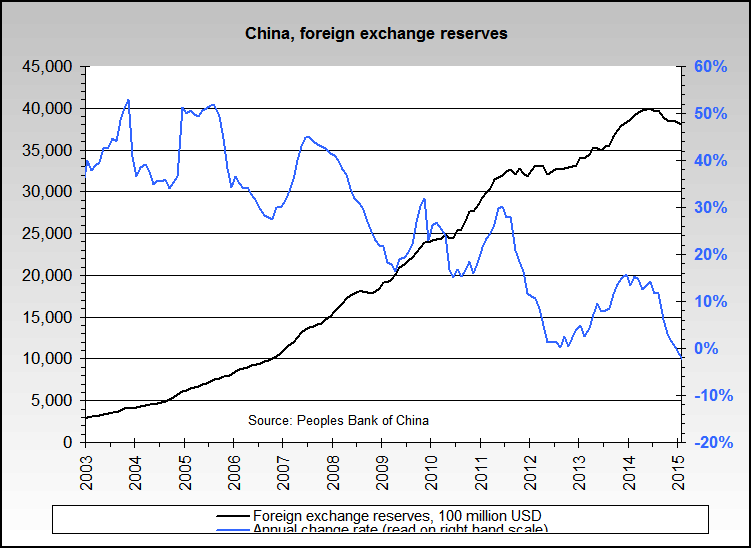
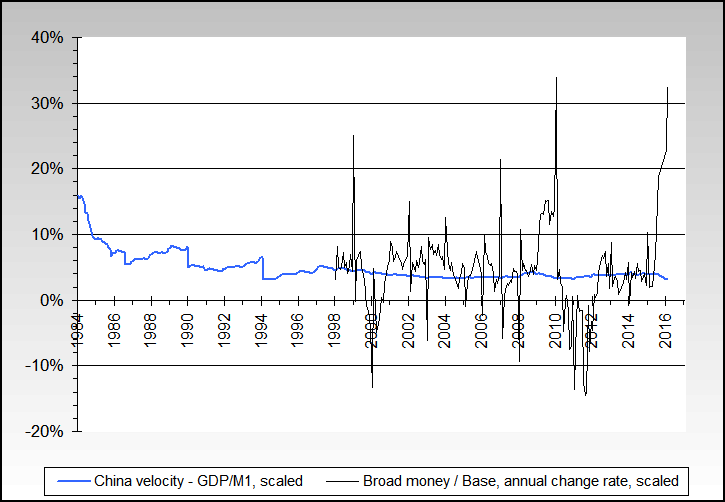
People's Bank of China
Short term, annual change rates
Long term, annual change rates
Foreign exchange reserves
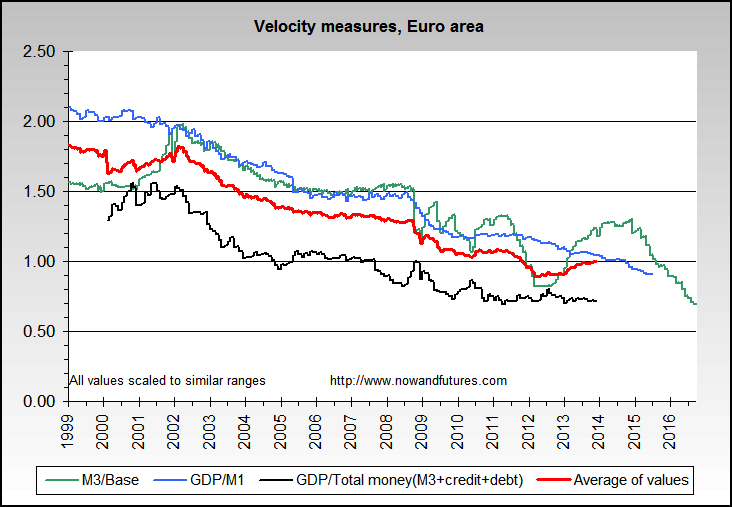
Velocity proxy
Source
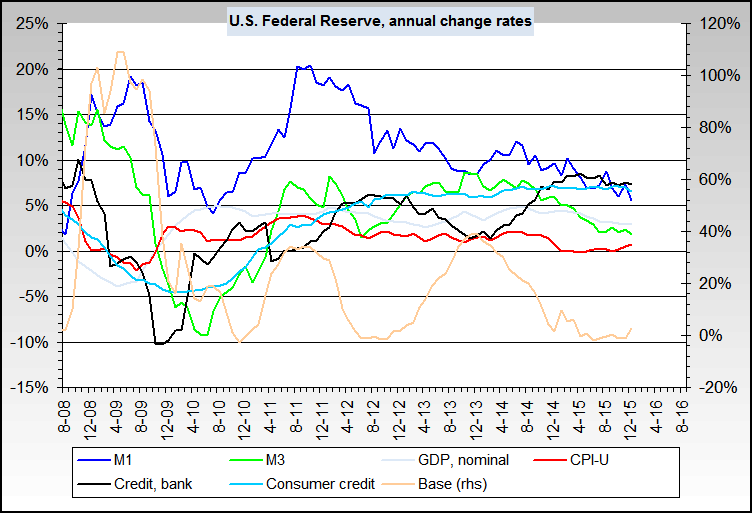
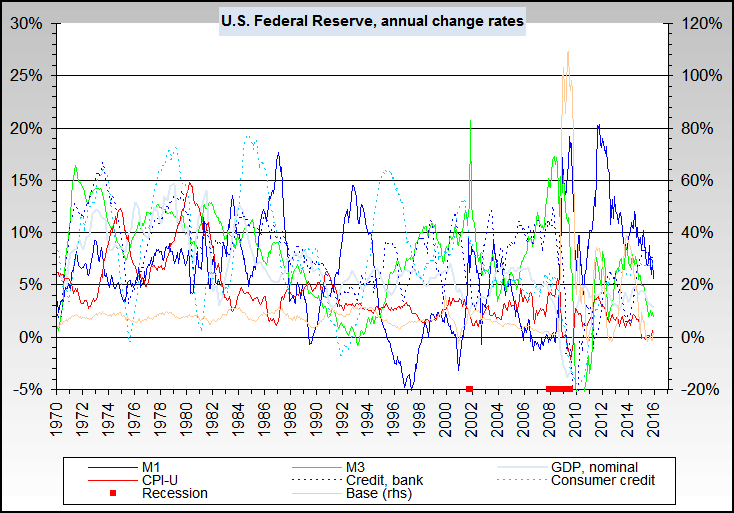
U.S. Federal Reserve
Short term, annual change rates
Source
Long term, annual change rates
Source
See money and lags for more data. It applies to the US Federal Reserve but the lag concept applies to all central banks, they just differ on the size of the lags.
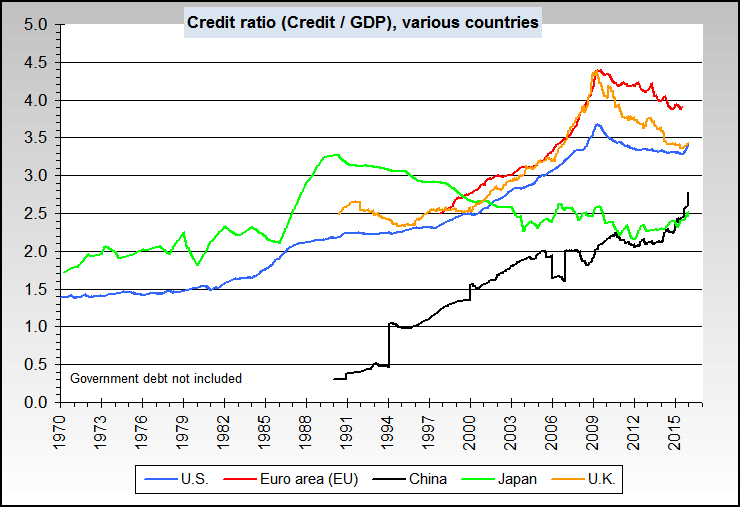
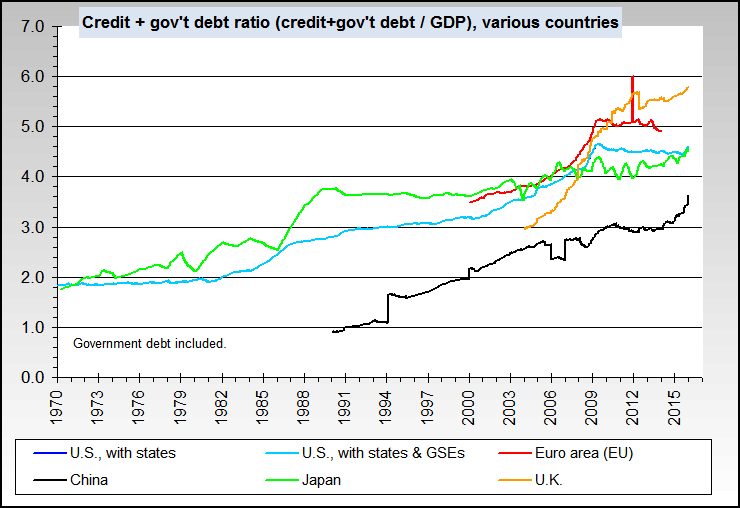
Credit & debt multipliers
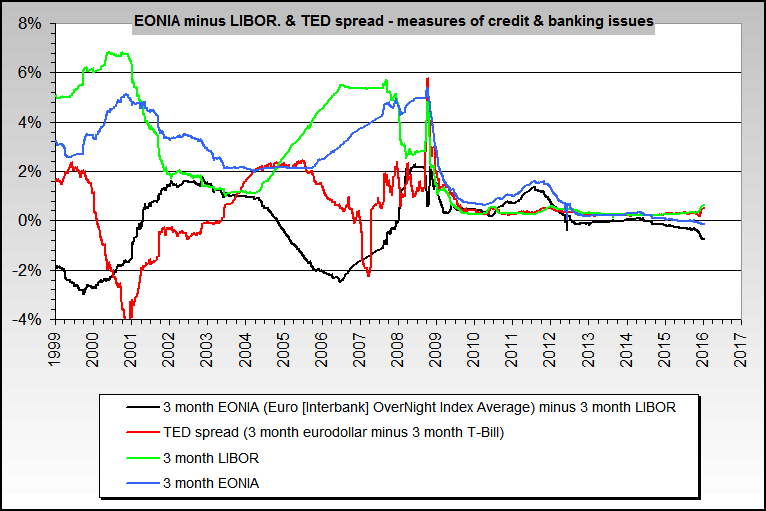
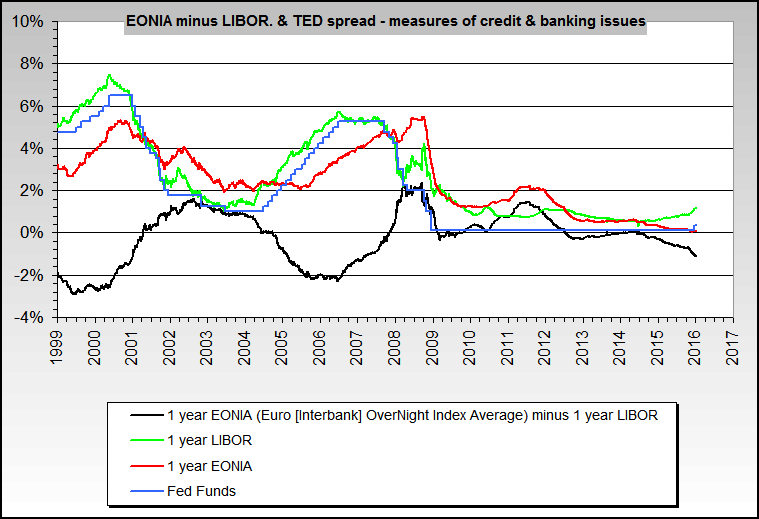
Interbank trust
The charts below show the differences between the 3 and 12 months LIBOR (London Interbank rate) and EONIA (European [Interbank] Overnight Index Average) rates. The size of the gap (the black line) and its trend are a direct measure of how much various banks trust or distrust each other, and indirectly a measure of crisis or calm.
3 month data
1 year data
Eonia only, raw
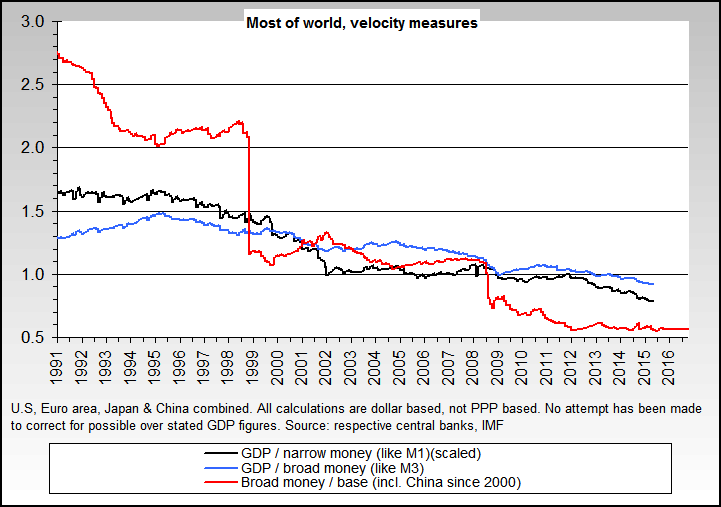
How fast is money moving through most of the world?
The actual money of money and credit being created is only part of the picture. Velocity must also be factored in since it affects the amount of total money in an economic system. Velocity is low in a depression and high in a hyperinflation.
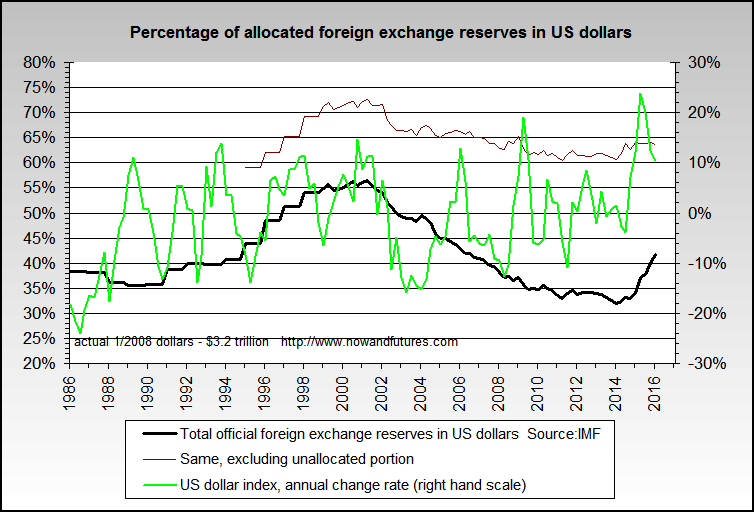
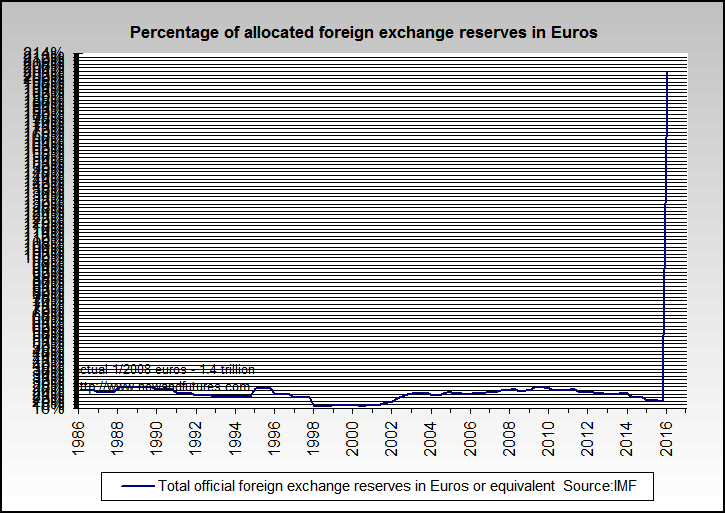
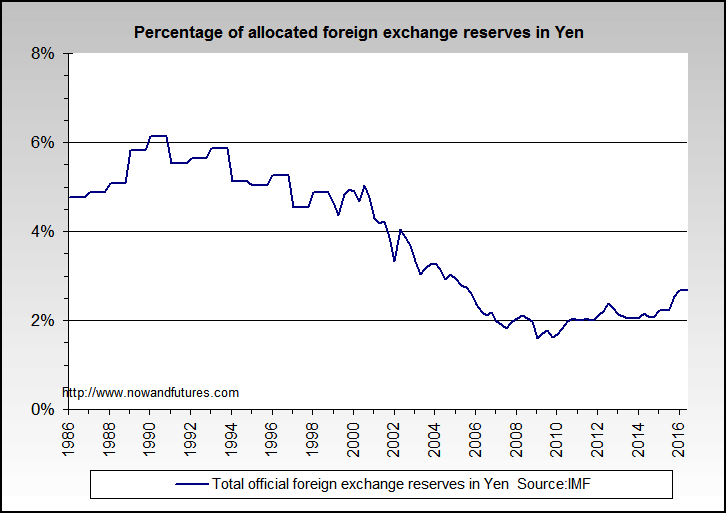
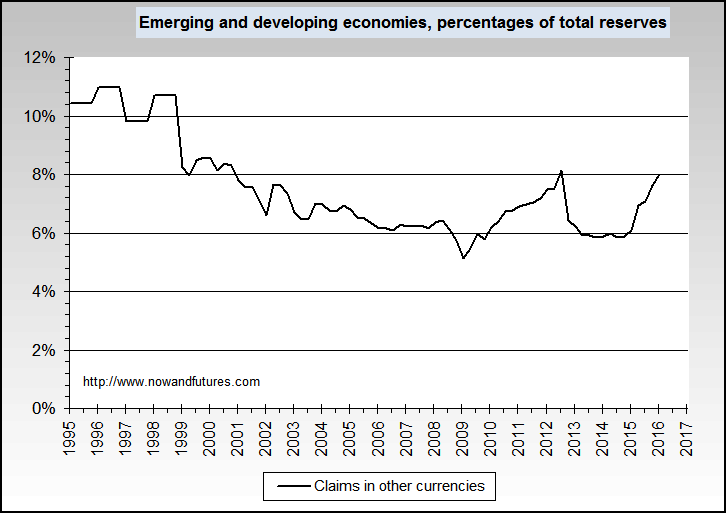
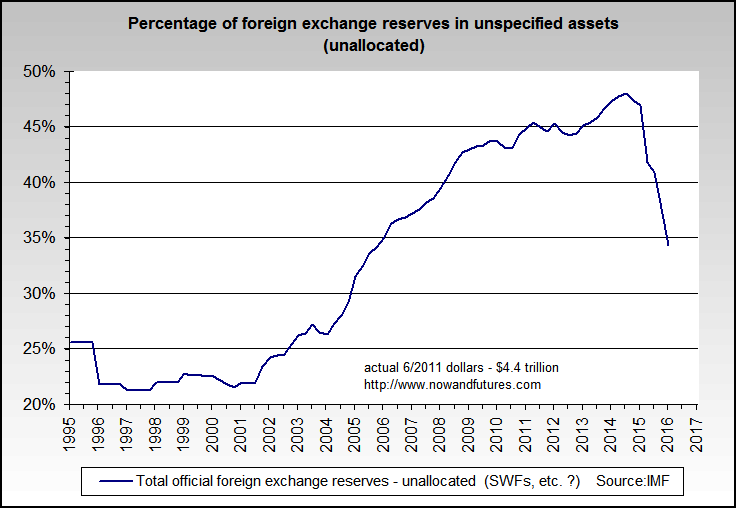
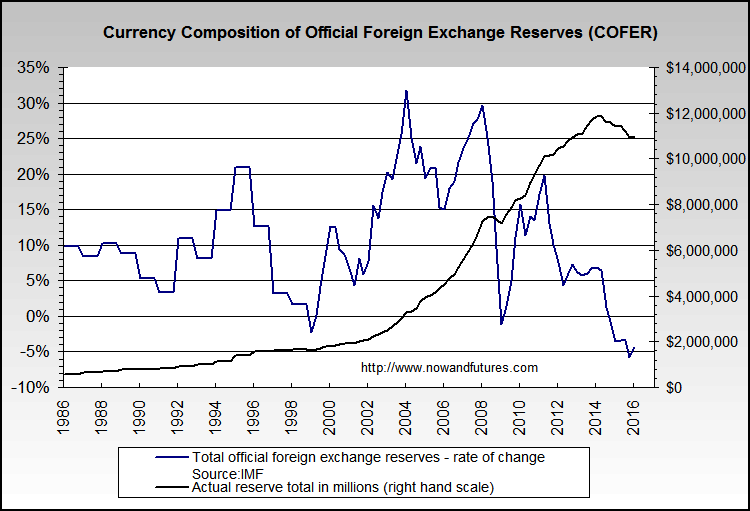
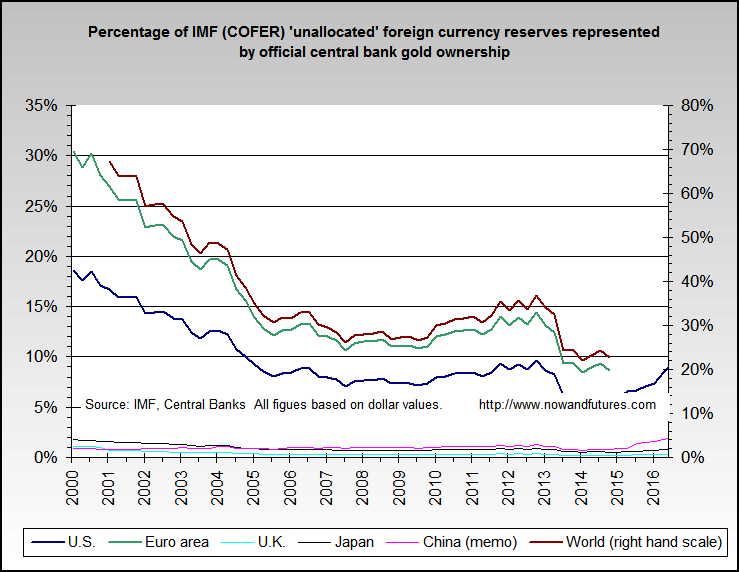
Composition of Official Foreign Exchange Reserves (COFER)
These charts show where the reserves of the various central banks of the world are held, and are useful in determining longer term trends and trend changes. Note that data is only issued and published quarterly, and that the data only covers about 50-60% of the world's central banks (China is not included for example).
Note: "unallocated" in this context means that the central banks have not reported where the full amount of their reserves are located.
As of mid 2006, about 33% of their total reserves is secret and undisclosed.