Real Estate


Philadelphia Housing Index

Median and average sales prices of houses sold in the US

The problem with using median home prices

The Housing Bubble Blog

Free, Instant Valuations and Data for 60,000,000+ US Homes

Long Term Real Estate Cycles

Patrick's Housing Blog

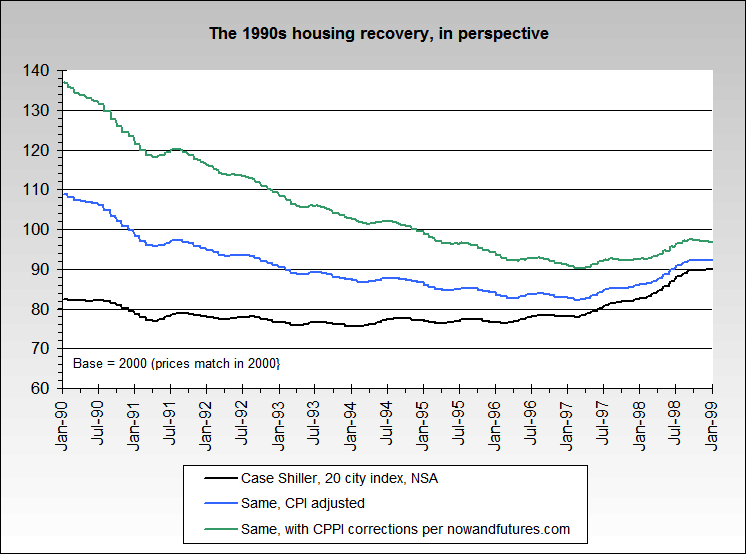
Echoes of 1990?

Fifteen Years to Revert to the Mean - a possible scenario


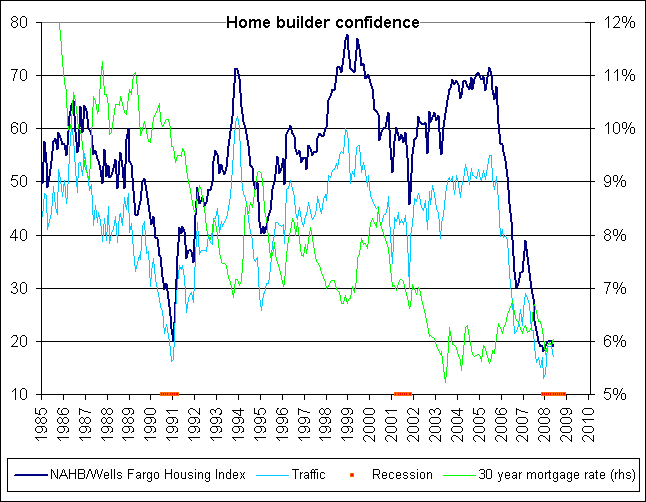
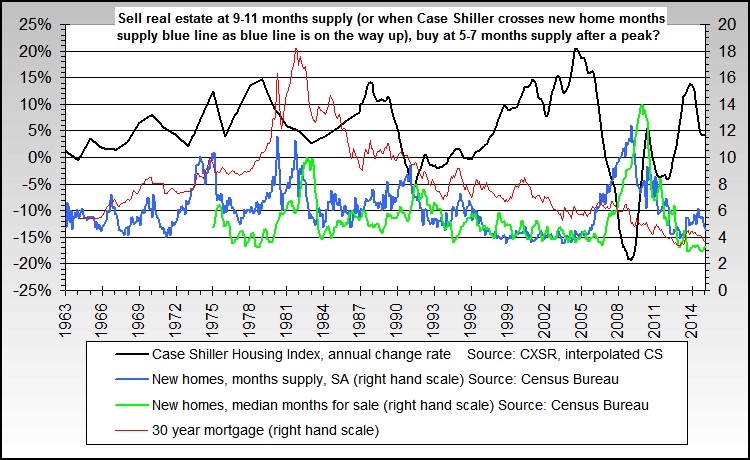
Inflation adjusted real estate bottoms occur at 5-7 months supply after a peak


h1

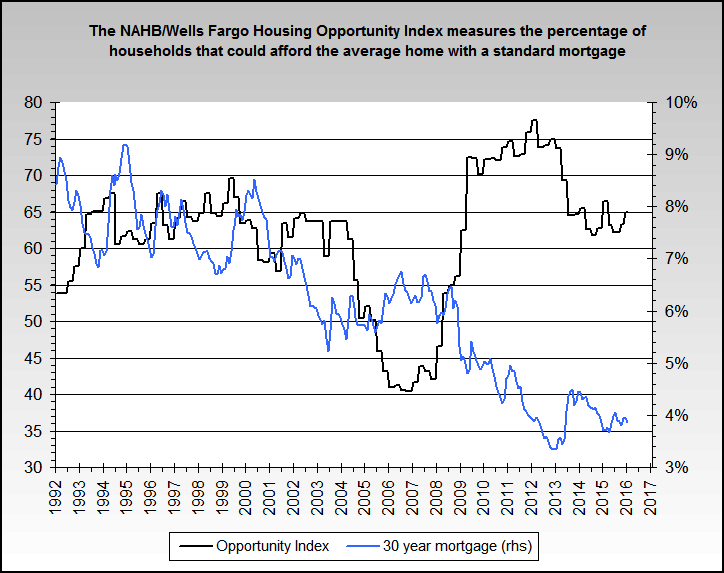
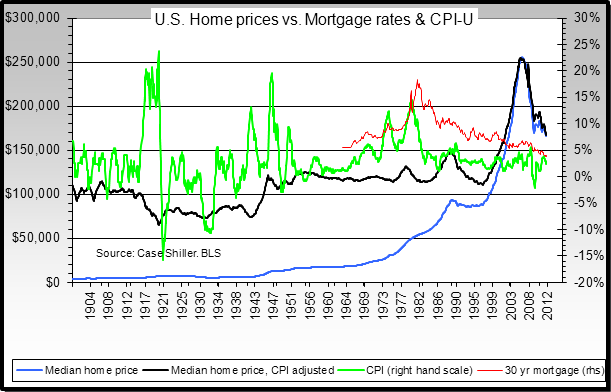
Same chart, but with 30 year mortgage rate


c1


n1


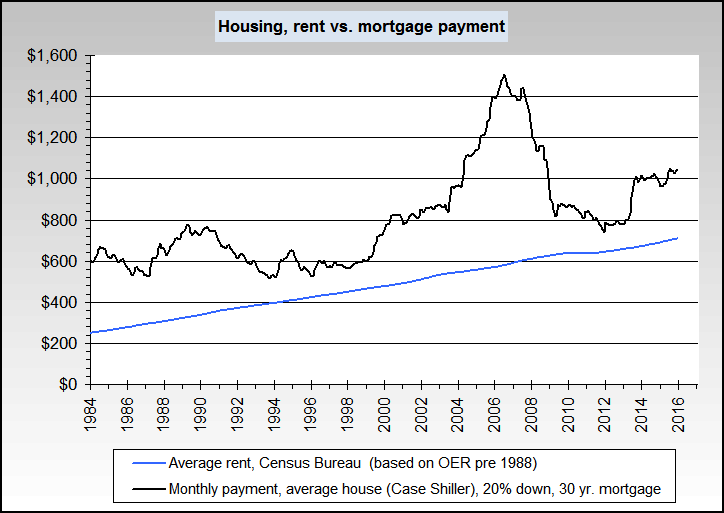
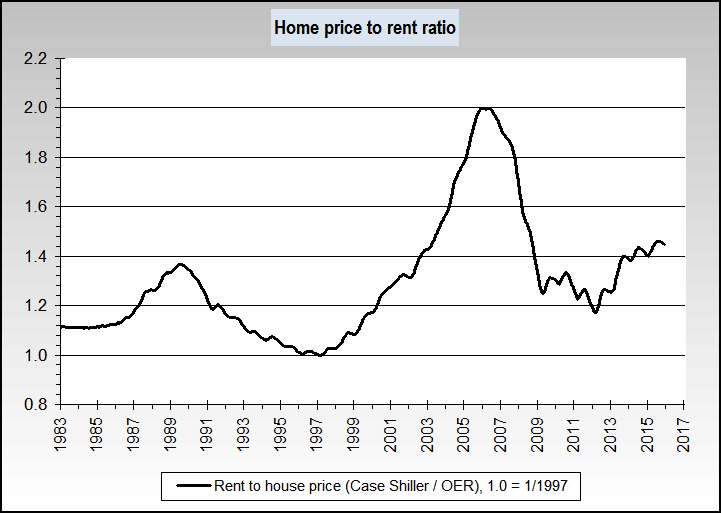
Looking for the real housing bottom & mortgage vs. rental & inflation adjusted indexes


rent_mortgage


cpi adjusted


cpi adjusted3


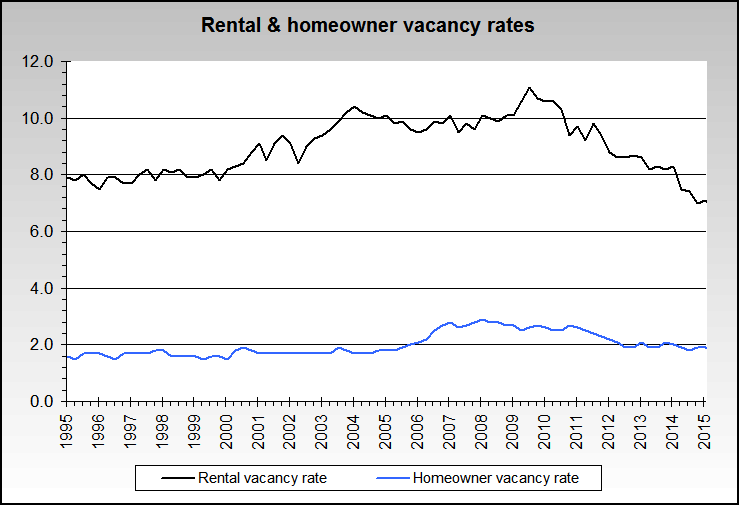
Rental and homeowner vacancy rates


alt101


September 8, 2013:
Housing Prices
Weakness in Dataquick weekly median home price (blue line), probably at least a temporary price top is in place. Third week in a row showing price drops. Both the XHB homebuilder and the PHLX (HGX) housing indexes have also not been strong for a while.

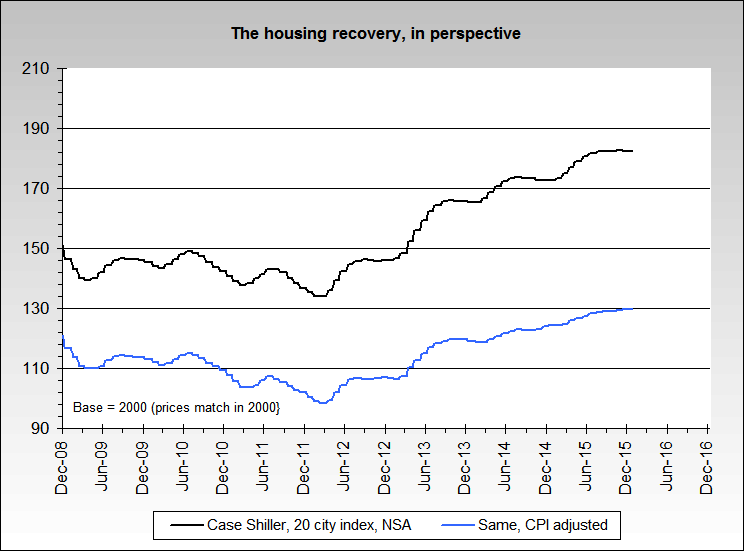
Housing recovery perspective, still lower lows and lower highs when the Case Shiller 20 city average is just CPI adjusted, and definitely no new highs when a CPPI adjustment is made.


March 8, 2012:
Housing Prices
CR has called for a bottom and today Robert Shiller echoed it. We're over 50/50, but not calling it yet primarily due to uncertainty about how many foreclosures are still in U.S. inventory. Our best guess is that there are currently over 2 million in unlisted inventory, well over the ~6 months of supply that's normally a bottom indicator. It's certainly not a horrible time to buy if one is in the market though.


September 15, 2011:
Housing Prices
We're at a minimum of a 1 in 2.5 chance of a housing bottom within 6 months.


October 15, 2010:
Housing Prices
"Forecloseure-gate", etc. - the bottom is not in yet on any sector of home prices. We blew it on the bottom call for the lowest priced 20%+ of homes. That's why we use relative confidence levels like "2 in 3".


May 2010:
Housing Prices
We're reversing again on our September 2009 tentative bottom call for the bottom 20%+ of home prices. We now believe that the chances are around 2 in 3 that they have bottomed, as well as most areas of the country where the bubbles did not strike.


December 2009:
Housing Prices
We're backpedaling on our September 2009 tentative bottom call for the bottom 20% of home prices. We now believe that the chances are less than 1 in 3.


September 2009:
Housing Prices
Tentatively (as in chances of 2 in 3), it appears that nominal prices have bottomed for the bottom 20% of home prices. This assumes that mortgage interest rates are included as part of the full picture. Our forecast also does not mean that there will not be another downward spike later in 2010-2011, but does mean that we believe that it will not set new fully inflation adjusted low prices for mortgage payment based lower priced homes.


April 2009:
Housing Activity Forecast
Simple summary, with which we agree - new home sales close to or at a bottom, existing home sales have a ways to go, prices have not bottomed.


March 2009:
"The temporal ordering of the spending weakness is: residential investment, consumer durables, consumer nondurables and consumer services before the recession, and then, once the recession officially commences, business spending on the short-lived assets, equipment and software, and, last, business spending on the long-lived assets, offices and factories. The ordering in the recovery is exactly the same."
From: Housing and the Business Cycle (pdf)
Source: Calculated Risk
Simple summary - watch Residential Investment & PCE for recovery signs.


Sept 2008 - Just to clarify, our best guess for the initial bottom in real estate is early 2010, with early 2011 as our barely second best guess). See the months supply chart above for further and ongoing guidance. (added Nov 2008 - the hotter markets like California & Florida will bottom later. Note that if government clearly allows private capital, as opposed to just banks and FNM/FRE, to participate then the bottom will occur sooner.) Also note that the Architectural Billing Index tends to lead construction spending by 3-4 quarters. Finally, note that the bottom prediction is for nominal, not inflation corrected values.


August 2008 - Commercial real estate, per the Moody's/REAL Commercial Property Price Indices (CPPI), is now about 12% below its peak in October 2007. (link no longer exists as of 2012)


May 2008 - no significant signs of a bottom yet. Commercial real estate falling ( US Commercial property price fall most since 2000 ). Note that the lag was about average at 5 quarters after the residential price peak.


February 2008 - no significant signs of a bottom yet. Commercial real estate faltering.


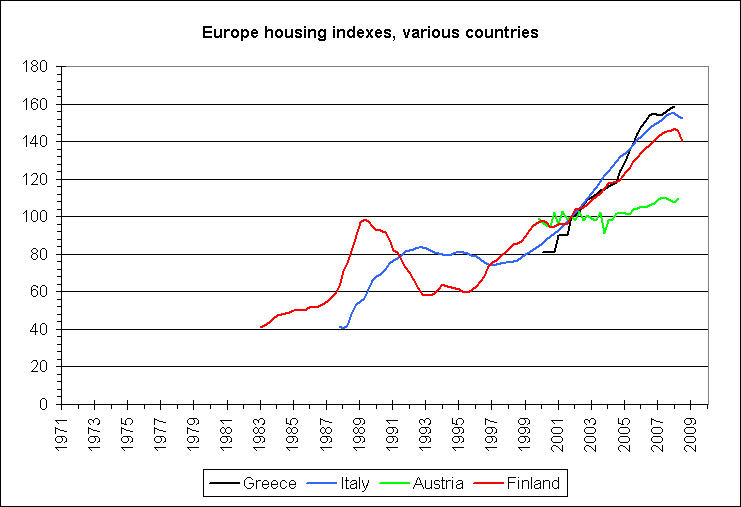
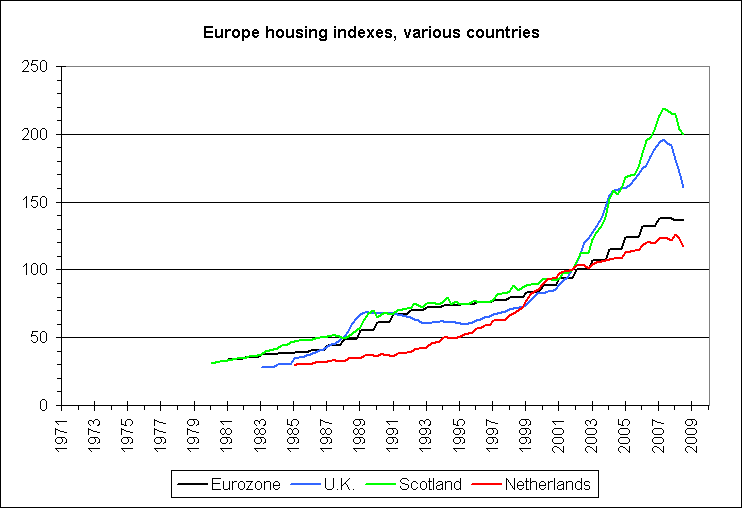
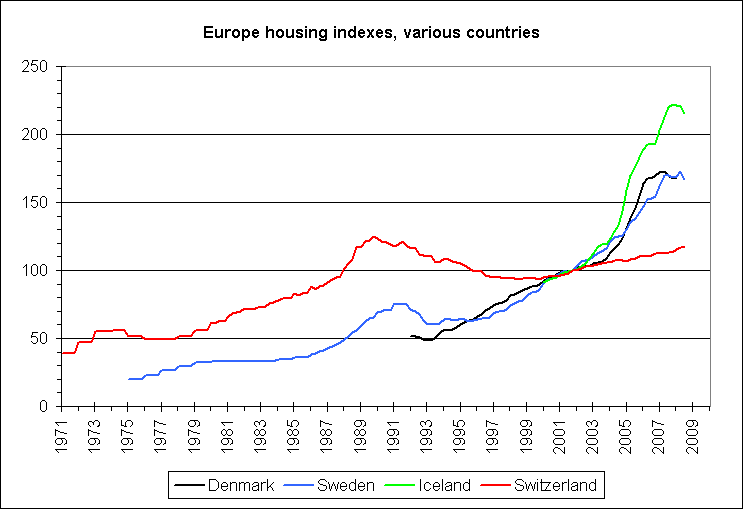
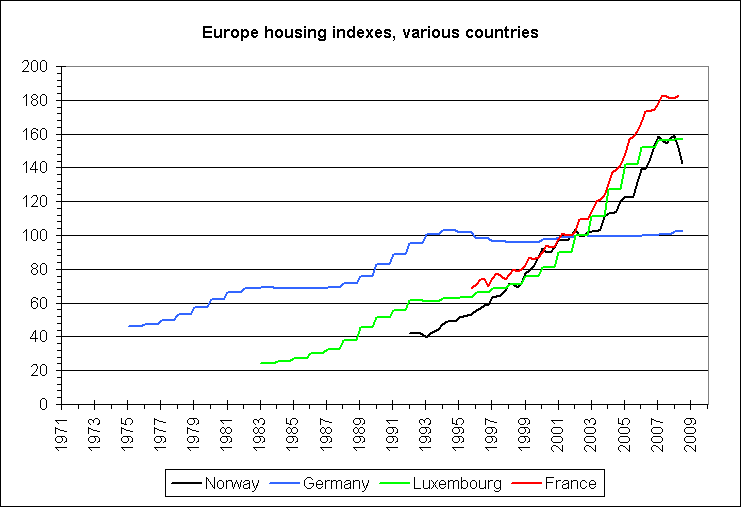
August 2007 - Overheating sees house price downturn in Europe


April 2007 - US Housing Crash Continues It's A Terrible Time To Buy


January 2007 - “We’re in the very early stages of the current housing slowdown. Most of these downturns are longer and deeper, and right now we don’t see anything on the horizon that would change that opinion. We continue to see a very challenging industry environment for fiscal 2007”.
-- Don Tomnitz, CEO of DR Horton, the largest US homebuilder


November, 2006 - In response to requests, our best guess is that the very earliest possible conceivable date that US real estate will bottom is the 1st quarter of 2008, barring 'black swan' type events. Normal housing bear markets last a minimum of 36 months in a few markets.

Five to seven years is the historical norm for all housing bear markets.

Regarding how much further it will correct, this chart shows that the average drop of real estate investment is 22-25% (sales of new one family homes too) and we've only dropped about 8% so far.
On average, the bottom in actual home prices during a down cycle is 5-7 years after the peak. That would place the bottom in 2010-2012. Other handy ways to help judge a bottom include average house prices being about 2.5-3 average incomes, total housing inventories having declined to the 7-8 month supply level (new housing inventory at 5-6 months) and of course looking at the stages of real estate cycle near the bottom of this page.


October, 2006 - Angelo Mozilo, the CEO of Countrywide – the country’s largest independent home mortgage lender - recently stated: "I've never seen a soft-landing in 53 years, so we have a ways to go before this levels out. I have to prepare the company for the worst that can happen." (during a conference call on July 25th, 2006)

February 7, 2006 National foreclosures increase in every quarter of 2005 according to REALTYTRAC™ U.S. Foreclosure market report

San Francisco Bay Area Housing, has a good data analysis of the overall market.

September 20, 2005 - It appears again that the top is in.
The Fed has raised interest rates another 1/4% The Philadelphia Housing Index was down almost 5% today and over 11% since its peak. This will likely be the last update to this page, unless something very unusual happens.

August 27, 2005 - In closing remarks of the Jackson Hole conference, from Chairman Greenspan:
"Nearer term, the housing boom will inevitably simmer down. As part of that process, house turnover will decline from currently historic levels, while home price increases will slow and prices could even decrease."
Source

August 27, 2005 - Another statement from Donald Kohn, one of the other governors of the Federal Reserve Banks"
"The risk is that private agents overestimate the ability or willingness of central banks to damp volatility in asset prices or the economy..."
Source

August 26, 2005 - A little unclear, in the way of Central Bankers and Mr. Greenspan but here's an extract from his speech:
"Thus, this vast increase in the market value of asset claims is in part the indirect result of investors accepting lower compensation for risk. Such an increase in market value is too often viewed by market participants as structural and permanent. To some extent, those higher values may be reflecting the increased flexibility and resilience of our economy. But what they perceive as newly abundant liquidity can readily disappear. Any onset of increased investor caution elevates risk premiums and, as a consequence, lowers asset values and promotes the liquidation of the debt that supported higher asset prices. This is the reason that history has not dealt kindly with the aftermath of protracted periods of low risk premiums."
(emphasis ours)
Source

May 18, 2005 (old but key) - Even Alan Greenspan admitted there's a bubble, but in a very conservative way befitting a banker. In a speech at the Economic Club of New York he said "...there are proliferating signs that the housing market is looking a bit frothy". Our dictionary defines froth as "A mass of bubbles in or on a liquid; foam".

August 11, 2005 - June 2005 California's Housing Affordability Index

August 8, 2005 - It appears that the top is in.
The Philadelphia Housing Index is down 8% in the last week.

August 7, 2005 - Long-Term, 1995-2007 Pictures of the US Housing Supply-Demand, Vacancy, and Renters vs. Owner Occupancy

July 31, 2005 - THE US HOUSING SUPPLY-DEMAND Countering Lies with the Facts (Data)

July 25, 2005 - Bloomberg - "U.S. sales of existing homes rose a surprising 2.7 percent to a record in June..." but no mention was made that the inventory of unsold homes also rose 3.8% to 2.653 million.

July 21, 2005 - San Diego Condo market appears to have peaked some time ago. Inventories are running about 3 times higher and the median price is down over 10% when compared to last year, per sdcondo.com (statistics went private in late 2005).

The Economist, Week of June 23 - "Measured by the increase in asset values over the past five years, the global housing boom is the biggest financial bubble in history. The bigger the boom, the bigger the bust."

Bank of England, Week of June 23 - "Even if risks are being appropriately priced given the current outlook, financial market participants have taken on relatively illiquid assets to enhance yield, possibly giving rise to difficulties in adjusting balance sheets."

July 5, 2005 - "A simple but worrying proxy for speculative buying in the housing market can be found by looking at the number of new houses that have been sold but are not yet under construction. This category now accounts for 40% of all new home sales!"
from John Mauldin's Outside The Box

June 30, 2005 - National Home Sale Prices Are Unseasonably Peaking ?

June 15, 2005 - Dataquick: Southland Real Estate Market Eases Back. La Jolla,CA----The sales pace of homes in Southern California eased back a notch in May... (link no longer valid)

June 2005 - The Economist: "A recent survey of buyers in Los Angeles indicated that they expected their homes to increase in value by a whopping 22% a year over the next decade. This would put the median price per house over $3 million. At current increases in income, the median family will only have $54,535."
(Even if the whole thing were financed at 5%, it would still mean monthly payments of $12,500, or nearly three times total monthly earnings.)

June 8th, 2005 – American Banker: “Appraisals that inflate home values are becoming more common and threaten access to credit, according to a report released this week by the national Community Reinvestment Coalition. ‘Problematic appraisal practices exist as a serious impediment to responsible lending, impede fair housing and equal access to credit, and place the American dream of homeownership and safety and soundness of the mortgage marketplace at risk…’ Most of the blame lies with lenders who want inflated appraisals so they can make bigger loans with larger interest payments…”

June 1st, 2005 – Bloomberg (Victor Epstein): “Contracts to buy previously owned U.S. homes rose in April by the most in 13 months as falling borrowing costs, rising job creation and speculative purchases drove demand. The index of signed purchase agreements, or pending home resales, rose 3.6 percent to 128.2, a record…The index averaged 120.6 last year…Resale contracts rose 9.2 percent in April from the same month a year ago. Pending resales gained in all four U.S. regions. Compared with a year earlier, the index increased 12.5 percent in the South, 10.1 percent in the Northeast, 8 percent in the West and 4.5 percent in the Midwest.”

June 1st, 2005 – MktNews: “The following is the statement released…by the Office of Federal Housing Enterprise Oversight… ‘Average U.S. home prices increased 12.50% from the first quarter of 2004 through the first quarter of 2005. Appreciation for the most recent quarter was 2.21%, or an annualized rate of 8.82%. The new data represent the largest four quarter increase since the third quarter of 2004, when appreciation surpassed any increase in over 25 years… ‘The House Price Index shows the rise in house prices continues at an extremely strong pace and raises the potential for declines in some areas later on,' said OFHEO Chief Economist Patrick Lawler. ‘House prices grew considerably faster over the past year than did prices of non-housing goods and services reflected in the Consumer Price Index. House prices rose 12.5%, while prices of other goods and services rose only 3.1%.”


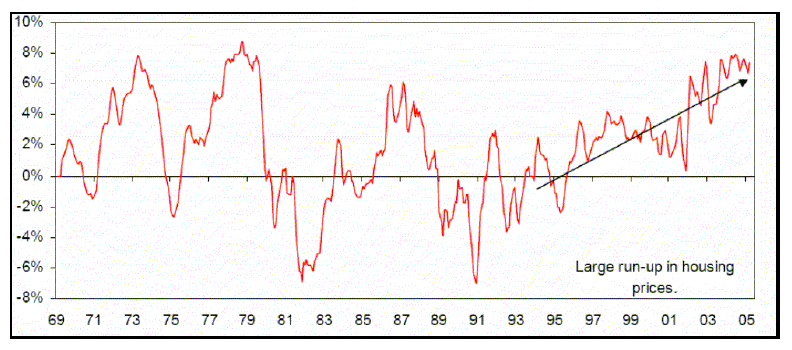
Inflation adjusted U.S. housing 1969-2005


San Francisco Bay Area Home Sale Activity
San Jose Mercury News Weekly Chart

Data is for the most recent four weeks - San Mateo as of May 5, 2005

Reporting resale single family residences and condos as well as new homes
* % Change is from the same month last year

  Median Price % Chg* # Sold % Chg*
All homes $750,000 20.4% 762 -18.7%
Total resale houses $800,000 21.0% 573 -19.1%
Total condominiums $485,000 14.1% 171 -3.4%
Total new homes $863,500 45.2% 18 -65.4%
Source - San Jose Mercury News (link no longer valid)


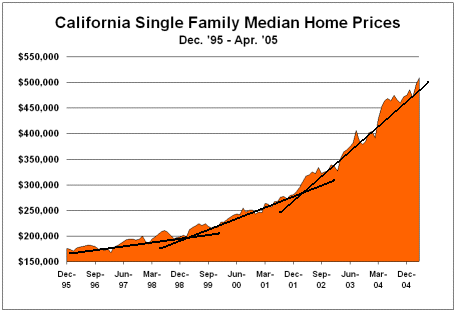
Trend lines added - (source, Credit Bubble Bulletin)

May 24th, 2005 - from the records of the Fed meeting from May 3rd - "Consumption expenditures were seen as likely to expand at a moderate rate and residential investment to slow. ... Fiscal policy was expected to provide a more moderate impetus to growth this year and next, following the substantial boost estimated for earlier years. ... Although the economic outlook generally seemed favorable, there was also broad recognition of greater uncertainty attending the outlook for both inflation and output growth. " (source)

May 22th, 2005 - "from the Mortgage Bankers Association, show that adjustable-rate and interest-only mortgages accounted for nearly two-thirds of mortgage originations in the second half of last year. "

May 16th, 2005 - "US banking regulators issued a warning to lenders on Monday to tighten up their lending standards." (original source)


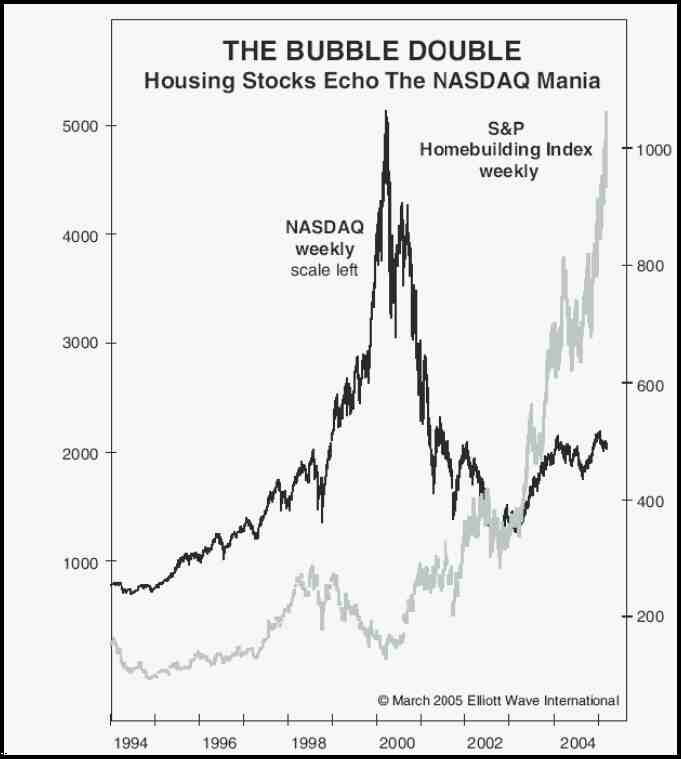
Not that we're necessarily at a peak (April 2005), but the similarity is striking...

Static graph - source: Elliot Wave International


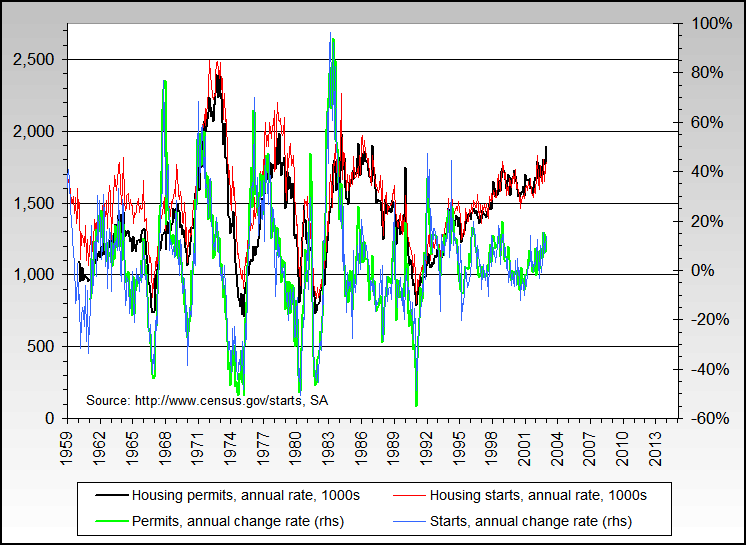
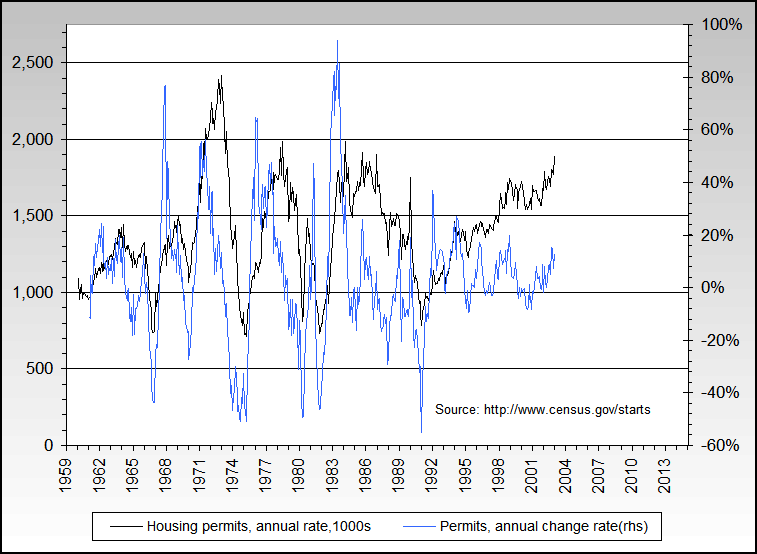
Housing starts & permits, seasonally adjusted


sp1


sp1


International Real Estate 1975-2004

from The Economist

Housing Market Index


Historical Evidence of U.S. Home Price Booms and Busts, 1978-2003


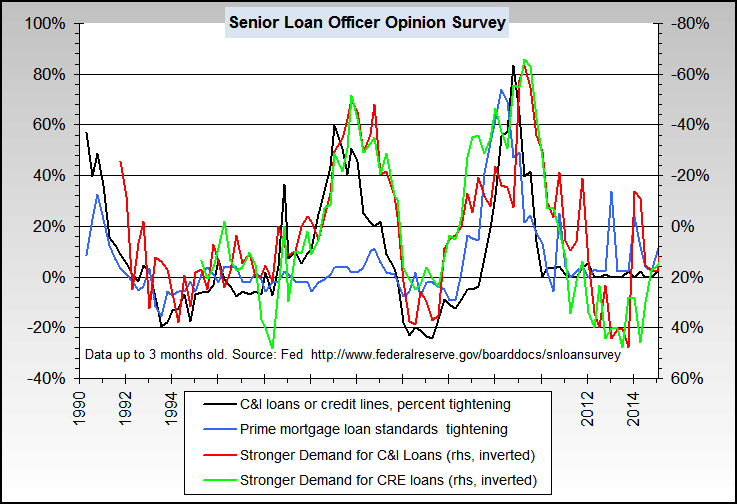
Senior Loan officer survey


Mortgage Bankers Association - weekly application survey


Housing Affordability Index Info


US Average Home Sales Prices


International Housing Affordability Index


Existing Home Sales


FDIC - Industry Analysis


Commercial Mortgage Statistics


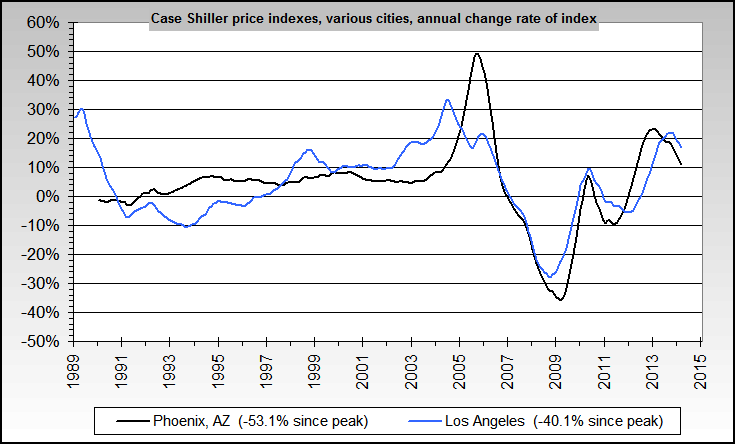
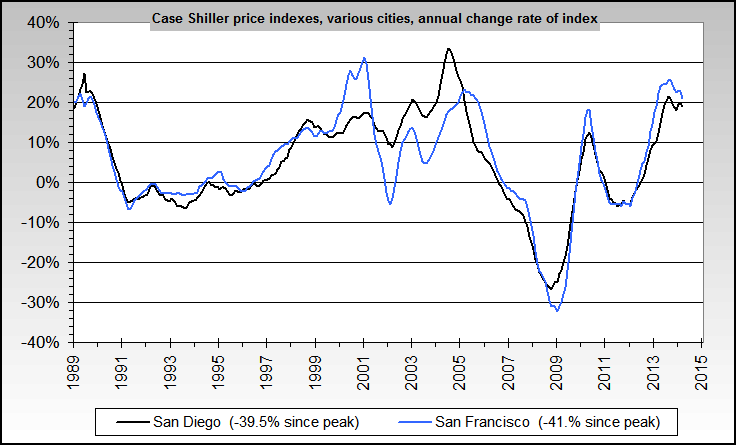
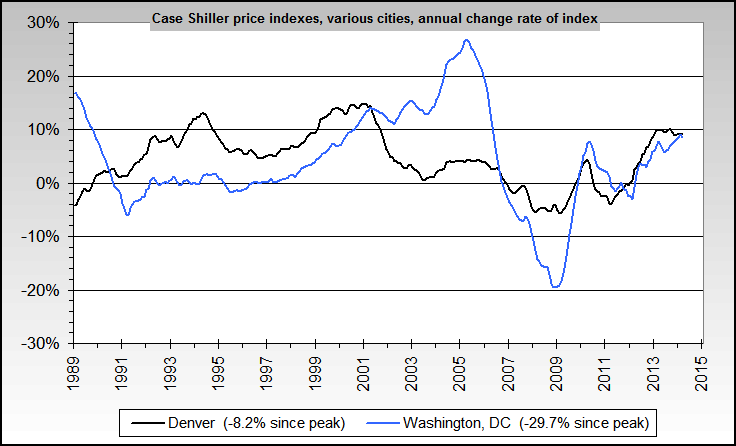
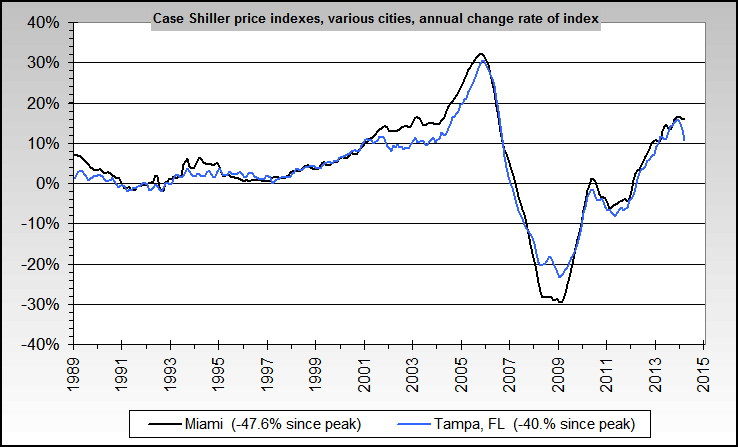
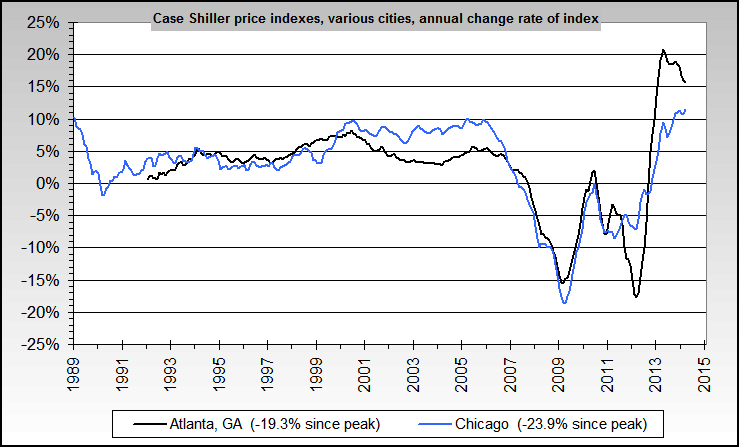
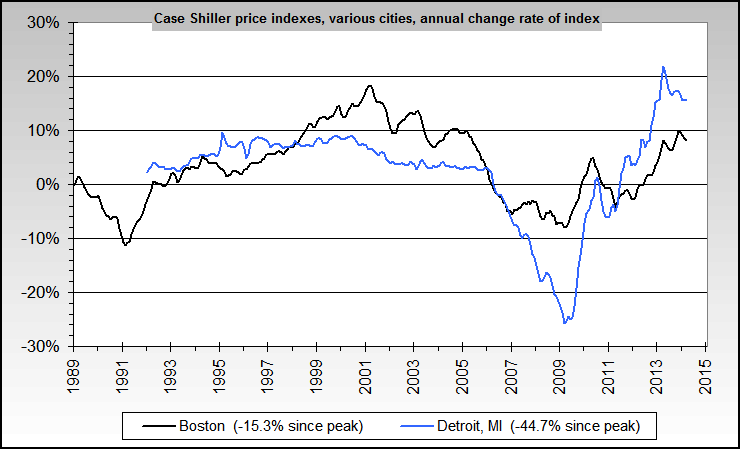
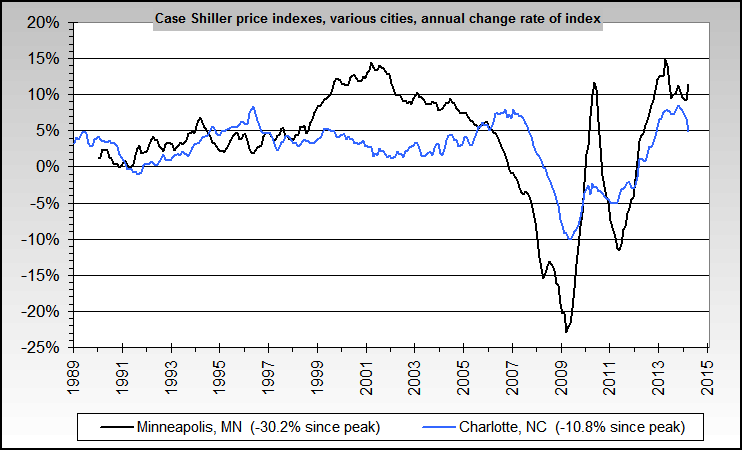
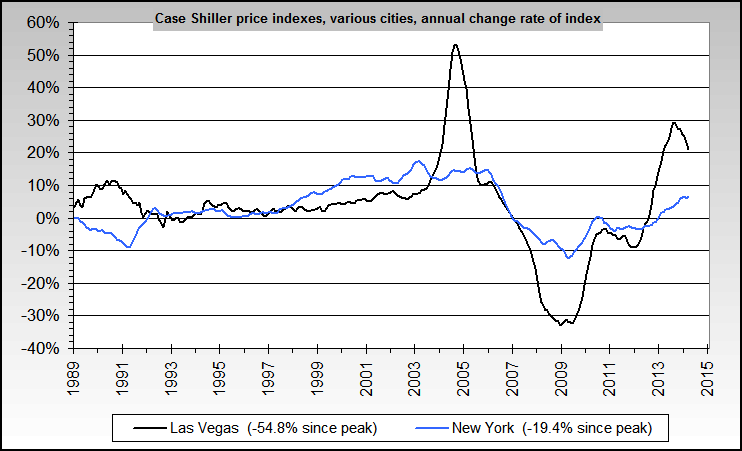
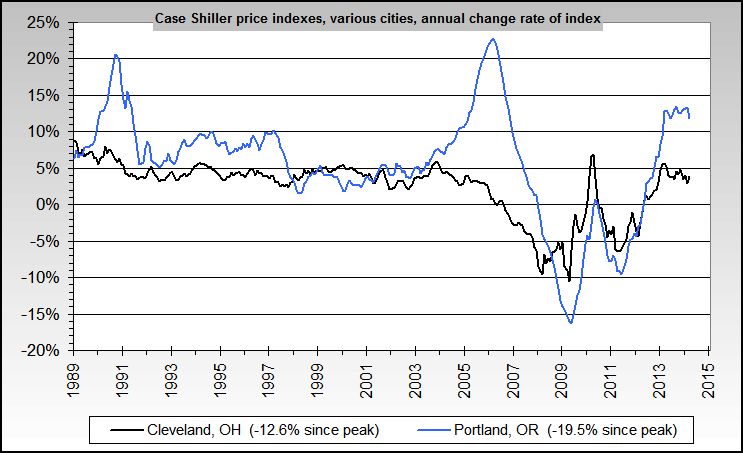
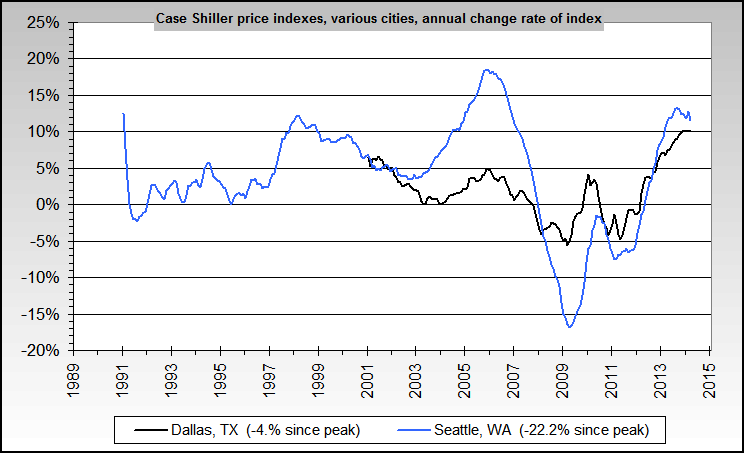
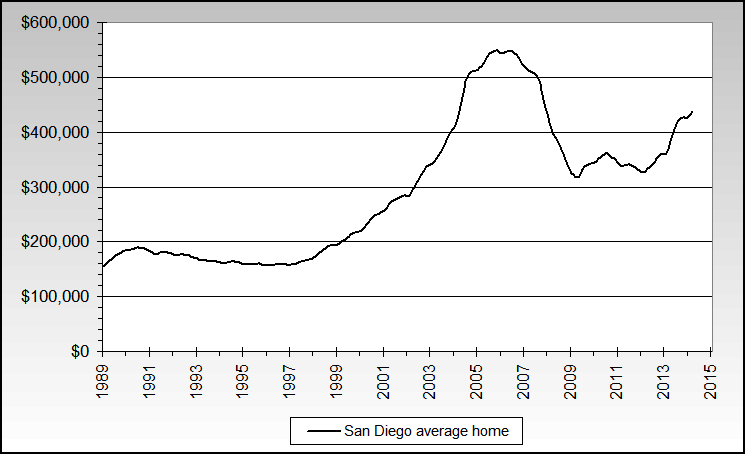
Case Shiller city indexes


01


02


03


04


05


06


07


08


09


10


10


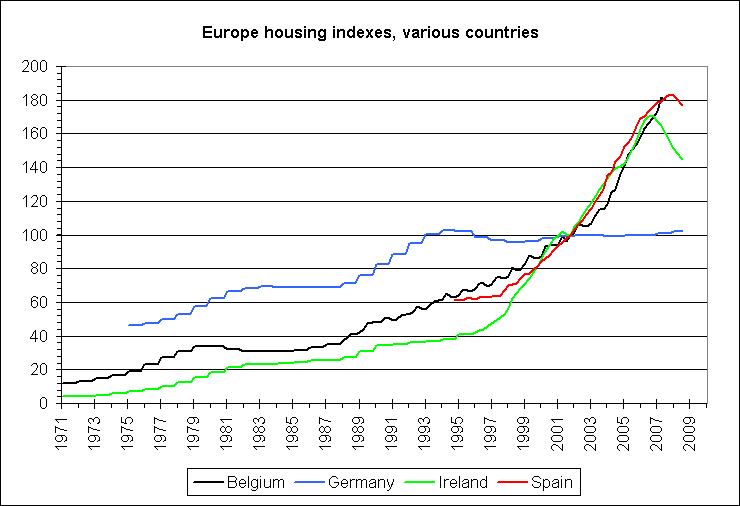
Europe FT housing indexes


01a


02a


03a


04a


05a


The Stages of the Real Estate Cycle

  1. Population growth and commercial growth at the early stage of the economic cycle, often supported by government encouragement/ low interest rates, creates an increase in the demand for housing and commercial buildings in excess of current supply.
  2. It takes time for construction to gear up. This construction increases demand for vacant land. Bank loans are attracted to construction and real estate sales as prices begin to rise.
  3. As vacant land prices rise a boom in land develops, leading to sub-divisions and speculative resale.
  4. The real estate cycle peak is characterized by a high volume of subdivision and sales.
  5. Construction catches up with demand and a small surplus is created. Rents can't go up enough to support the higher property costs, making new construction and rental property investment unprofitable. Land values start to adjust downwards, the bubble/mania is broken.
  6. Rising interest rates hurt confidence and profits, adding to the downwards pressure on prices. Real estate enters a 'hanging' slow phase. Asking prices stay high but there are few buyers. Building, subdivisions, and speculation drops quickly. Sometimes a panic or crash begins at this point; often the market just slowly dies. Many keep speculating during this phase as they're unaware of the market having turned.
  7. Real estate starts to get marked down in price. This tends to take quite a while as owners tend to cling to mortgaged property longer than they would to other assets, like shares. Foreclosures rise but the foreclosure process is not quick.
  8. Mortgage costs/interest rates are higher, rents decline, and vacancies increase. The market is dying rapidly. Foreclosures increase; speculators and investors are forced to sell as the capital value of their property decreases below lending margins and rents decrease below holding costs.
  9. The bottom of the market has the following characteristics: high vacancies, low construction rates, foreclosures and no speculation. Debt must be written off and properties sell at a deep discount. Only those who entered stage 6 with little or no debt survive to buy the dramatically discounted properties.
  • Note that in a typical real estate cycle that non-residential (commercial & industrial) real estate follows residential trends with a time lag of about 5 quarters (the historical range is 3-8 quarters).


rule