Update 7/5/2013 - Still on the alert for an entry point for a dollar short.
Bounces ahead...
6/23/2013Gold & silver options expiration on Tuesday, the 25th. The Fed is likely to make mention of the possibility of an increase in QE later this week if stocks continue down.
Update 6/24/2013 - Short the S&P again.
Counterparty risk: considering that interest rate based derivatives are about 80% of total derivatives ($223 trillion total in the US, $639 trillion total in the world) and the recent huge jump in various interest rates, the possibility of a repeat of a 2008 type crisis is not tiny.
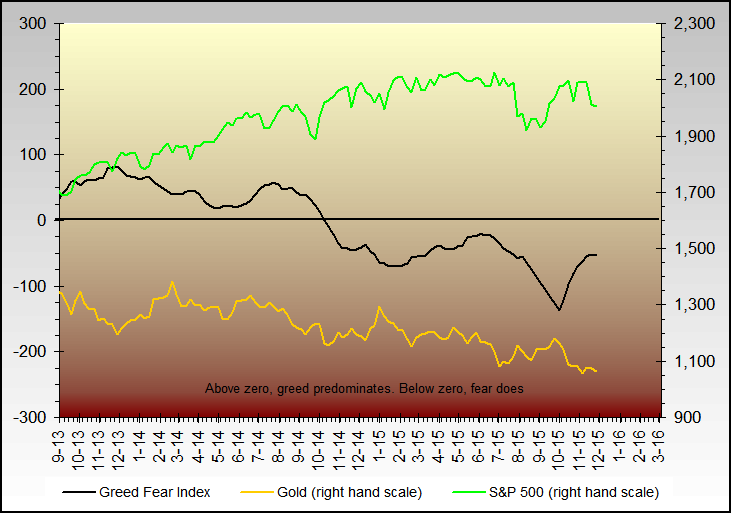
Greed Fear index, trend is unmistakable.
Considering a long position in the 10 year Treasury, for the bounce.
Took profits on 1/3 of our S&P shorts, we've hit a 7% correction level from the peak which was our initial target.
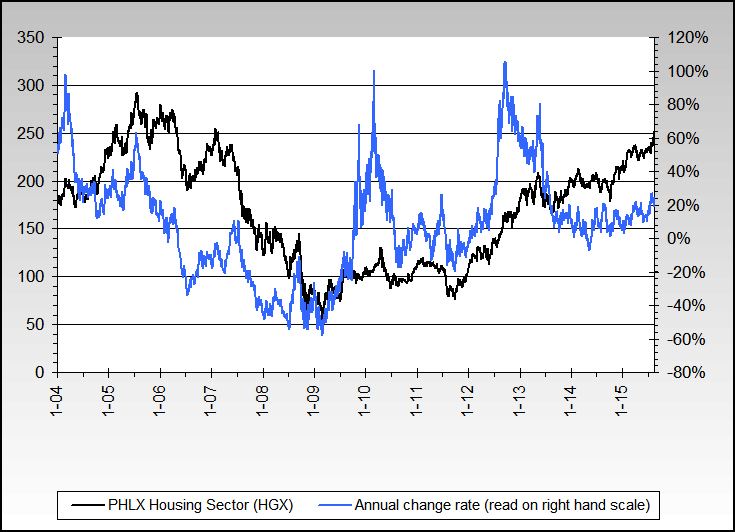
Update 6/25/2013 - Housing market relative weakness, PHLX index
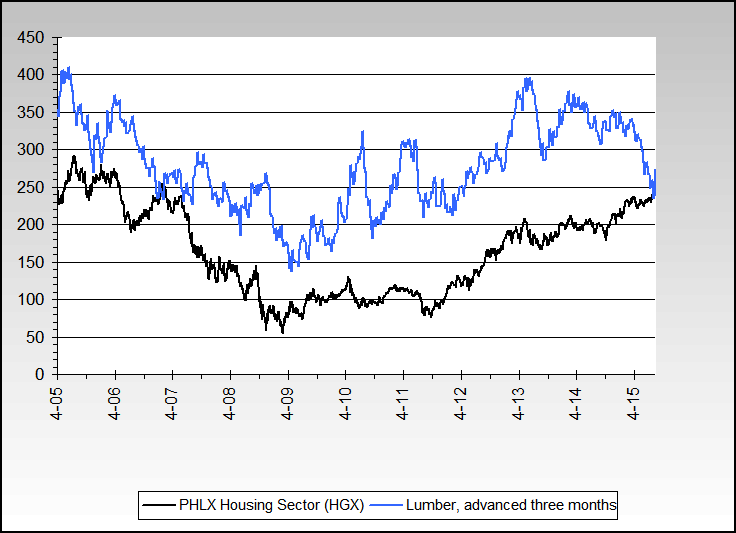
Same PHLX index, with lumber advanced 3 months
Exited S&P shorts for now.
Update 6/26/2013 - GDP revised down to 1.77% from 2.4%. GDP deflator up to 1.25% from 1.17% (CPI at 1.6%). Business investment down to .4% from 2.2%. Personal consumption 2.6% vs 3.4% expected.
Entered high risk long trade on 10 year Treasury (expecting rates to go down). Will add on break below 2.5%.
Update 6/27/2013 - Added to 10 year long position on the break below 2.5%.
BTFD?...
6/16/2013A break down and close below 15.5-16 on VIX will shift us to the long side, although we're mildly wary of the FOMC meeting report this Wednesday. We don't expect any real policy changes to be announced from the FOMC meeting, although we do expect some comments on and concern about the CPI & PCE disinflation trends.
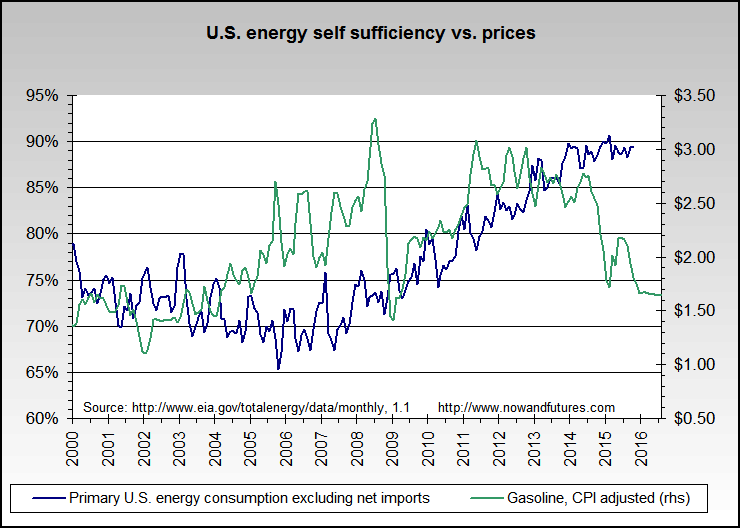
Peak cheap oil remains alive & well. So much noise about the shale oil production boom, but oil prices still remain quite high. Natural gas prices are down to 3.74 from a high of 4.25 week ending April 26th.
The conservative and non-extremist victory of Rohani as Iran's next president will notch down some Middle East destabilizing influences. Good news for a change, but offset and more by Syria.
Update 6/18/2013 - CPI-U 1.36%, Core CPI 1.68%, CPPI 4.35%. Owner's Equivalent Rent (OER) stuck at 2.1% annual change rate for 9 months running, in spite of large gains in housing indexes like Case Shiller. Household energy up 3.7% since last year, electricity up 1.8%. Disinflation trends still in place.
Update 6/19/2013 - SHIBOR (Shanghai Interbank Offered Rate) rates still extremely high, overnight rate up to 7.6% from 5.6% yesterday. Black swan event becoming probable.
FOMC results, basically no change. Resume speed - thank you.
Update 6/20/2013 - Still short the S&P 500 and added, back to our original 1606 resistance. SHIBOR overnight rate skyrockets to over 13%, 7 day rate over 11%.
The primary reason in our opinion for the overall drop in gold is net positive interest rates. This will also likely turn when gold bottoms.
While the Philadelphia Fed index was up from -5.2 to +12.5 today, the annual change rate with a 6 month MA for smoothing has been below minus 100% for 7 months in a row.
10:20 PM ET, lightened up and took profits on 1/3 of S&P shorts and 1/4 of gold shorts.
Update 6/21/2013 - 1:02 PM ET, took profits on all remaining shorts.
SHIBOR overnight and 7 day back down to 8.5%, PBoC added some liquidity.
The unexpected bond bear primary reason...
6/9/2013The Fed suddenly and relatively lightened up on the daily Securities Lending OMO. Notice that the daily amounts did not go up as rates went up, starting in early May, but did go up for control purposes in mid January.
Very substantial jump in China's SHIBOR short term rates.
Update 6/10/2013 - Reverse H&S on TNX pointing at 2.8-3.0%.
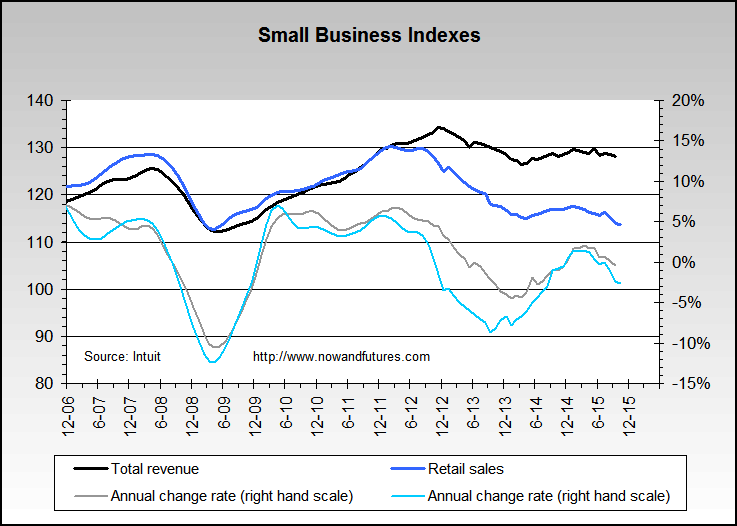
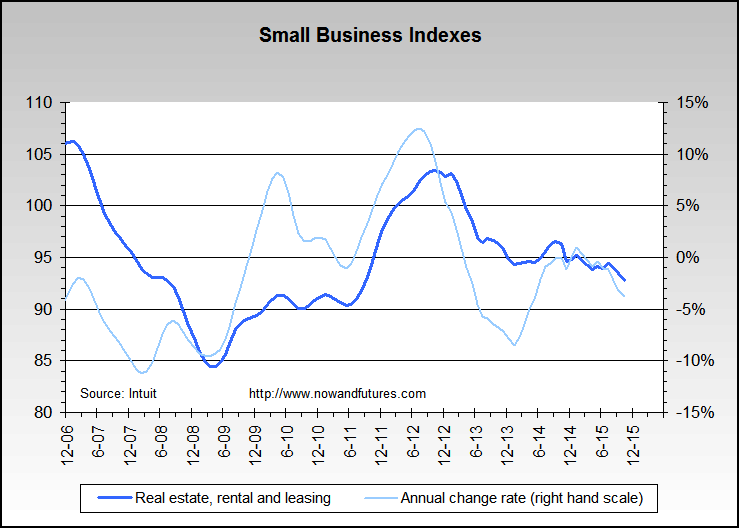
Update 6/11/2013 - Intuit Small Business Indexes, update - poor trends
Total revenue, retail sales
Real estate, rental and leasing
Employment, hours worked
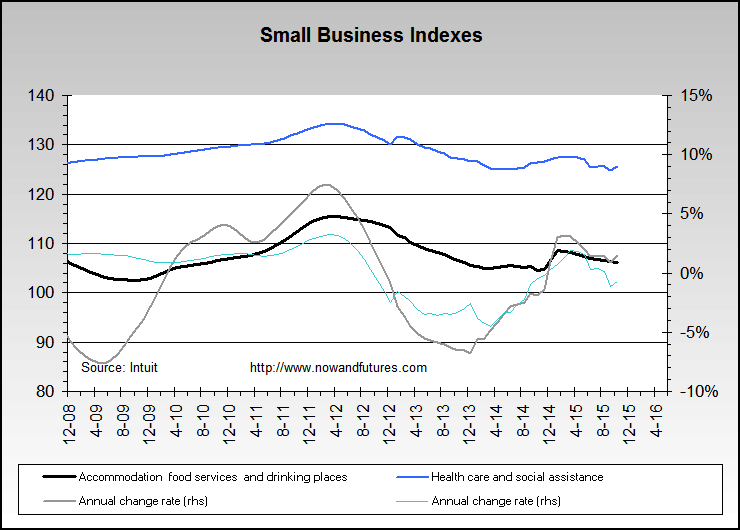
Accommodation, food service, health care
Bank of China showing substantial weakness. Does it lead the Philadelphia Banking Index (BKX)?
Update 6/12/2013 - The stock market is getting *very* dicey, we're mildly short but wary of sudden bullish surprises like a large drop in claims.
Fibonacci targets...
6/1/2013Based on a low of 666 and the previous 1565 high, here are possible reverse Fibonacci targets on the S&P 500:
1.500 2014
1.382 1908
1.236 1777
1.000 1565
Nikkei 225: (Friday close 13774.54)
100.0 15973.00 (intraday high)
76.4 14147.78
75.0 14039.50
61.8 13018.61
50.0 12106.00
38.2 11193.39
25.0 10172.50
23.6 10064.22
0.00 8239.00
PHLX Housing index vs. lumber prices advanced one year.
Best guess - probable bounce on the S&P 500 at around 1610-1620, to set up a double top this month.
Update 6/5/2013 - Since the S&P 500 peak at 1687 on 5/22, it's down about 3.4%. During the same period, the HUI miner index is up 7.7%.
Small short on the S&P near the close yesterday. Initial target 1606. S&P at close now down 4.6% since 5/22, HUI up 7.3%. Took profits on 1/3 of the shorts.
Update 6/6/2013 - Hit S&P target, exited final 2/3 of the position.
Update 6/7/2013 - Unemployment: U3 up to 7.6% from 7.5%, U6 down to 13.8% from 13.9%, U7 up to 21.5% from 20.9%. Non farm payroll, +175k. Birth/death mode, +205k. Unemployment mean duration up to 36.9 weeks from 36.5 weeks. Participation rate unusually up to 63.4% from 63.3%. Employed, usually work part time, +150k. Household survey, +319k employed. Part time for economic reasons, could only find part time work +194k. Total government employees -22k. Self employed -33k. Overall, not a bad report in the context of a 'recovery'.
Gold silver ratio, etc...
5/27/2013Rising wedge on gold silver ratio points relatively toward higher silver.
Update 5/30/2013 - Long silver, added to miner longs.
Update 5/31/2013 - Lifted silver long at small profit. Short squeeze is becoming more possible.
Recent jumps in various sentiment measures and Treasury interest rates are likely to translate to higher money velocity.
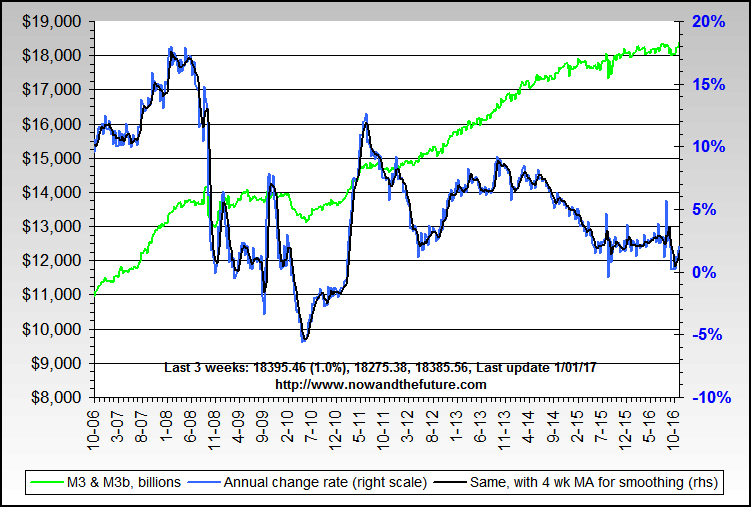
M3 growth - 7.5% since last year, same period
Dollar...
5/20/2013Too many dollar bulls, opened a short position this morning.
US stock markets are in hyperinflation mode, per the IASB definition of 25%+ gain per year for over 3 years.
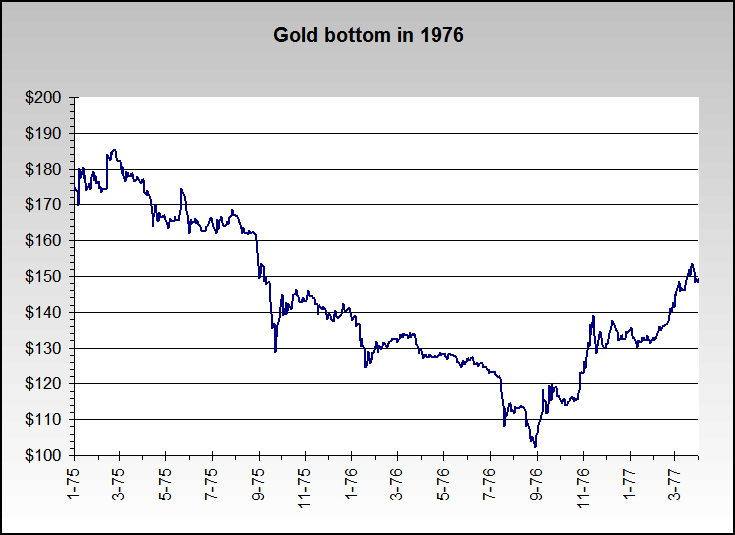
An observation: the bear market in gold from 1974-76 was accompanied by a drop in CPI-U from a peak of 12.3% (year over year) in December 1974 to a low of 4.9% in December 1976. Gold bottomed in August 1976.
Given the wild gyrations in both gold and silver since last night, we're around 50-50 on a bottom being in.
Update 5/21/2013 - Took profits on dollar shorts, trend broken.
Observations and guesstimates...
5/12/2013Japan's Nikkei 225's long term down trend line since the 22.667 high in 1996 will provide resistance around 16,000.
We expect a bullish spike on precious metals this week partly due to excess bearishness, and starting by or on Tuesday. It should also show up with a substantial move up in miners.
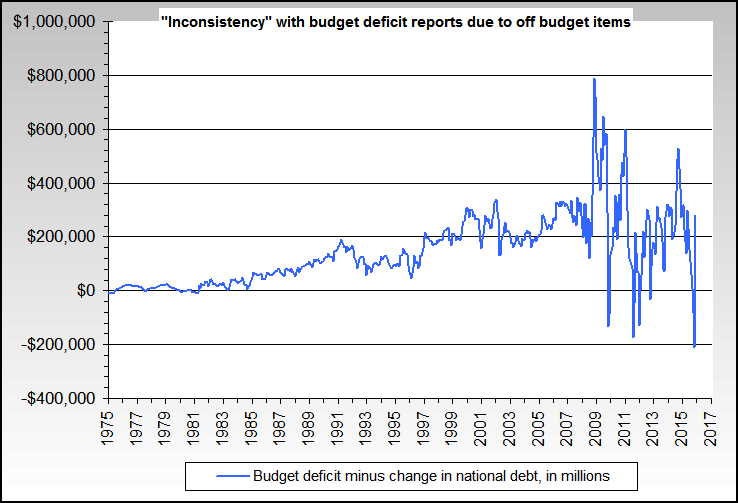
Update 5/13/2013 - The budget deficit is far from the differences in total debt, due to failures to include off budget items.
Inflation corrected retail sales remain flat to down. Retail gasoline prices are up to $3.60/gallon (from $3.54) in the most recent reporting week. Industrial production down, although still up on last year by 1.9%.
Update 5/16/2013 - April CPI-U 1.1%, Core 1.7%, Cleveland Fed median CPI 2.1%, CPPI 4.2%.
Risk off, bearish signal
L.A. plus Long Beach total container traffic down .8% from last year, last month down 11% from last year. Seattle port containers down 27%. Philadephia Fed current activity index down to -5.2 from +1.3, future activity index down 18% when compared to last year same month. Housing starts up 14.8% over last year, but down 7,800 houses since last month (not seasonally adjusted). Philadelphia Housing Index down 1.5%.
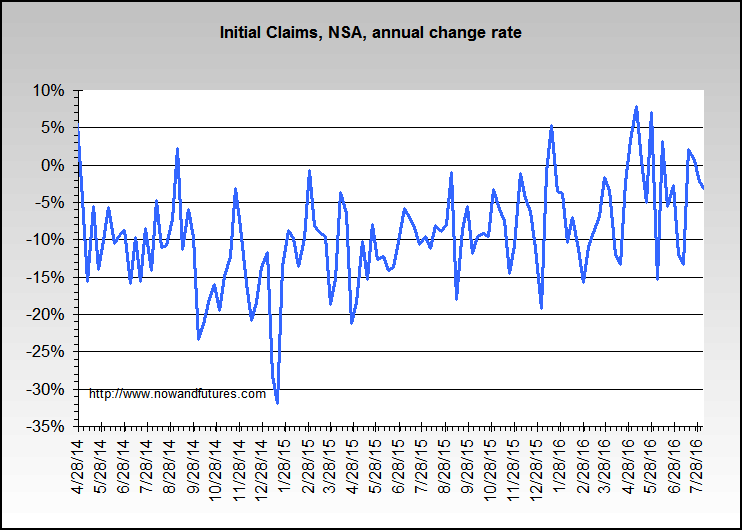
Initial claims trend
Update 5/17/2013 - US stock markets are in hyperinflation mode, per the IASB definition of 25%+ gain per year for over 3 years.
Exited last of wheat longs early this morning. Considering dollar short on a decent trend line break.
Middle East...
5/5/2013Israel vs. Syria - not much change in oil prices as of Sunday evening.
Update 5/6/2013 - Still little change in oil prices. Will lighten up on wheat later today due to weather positives.
Update 5/7/2013 - Gold likely trading range for a while (this week) - $1435-1480. Silver $22-25.
Next week should be an up week. We're keeping our powder dry, ready to buy.
Update 5/9/2013 - Added wheat on the trend break up... and dropped back on trend break down near the close.
Do it...
4/28/2013Boiling Frogs, Sheep and Lemmings... (external link)
Update 5/1/2013 - Net mild gold short, still holding wheat longs and added a bit.
Update 5/2/2013 - Reversed gold position, mildly long.
Closed all open gold positions near the close.
Update 5/3/2013 - Unemployment 7.5%, down from 7.6% (u3), 13.9% up from 13.8% (U6), 22.1% unchanged (U7b), average weekly hours down to 33.7 from 33.8. Employment up 165k, birth death (SA estimated) model up 204k, part timers as percent of total employment unchanged, labor force participation rate unchanged at 63.3%. Overall, a decent report.
Corrections...
4/20/2013Well above average chance of the start of a melt up in US stocks between Sunday afternoon and next Wednesday. A solid break below 1525 on the S&P would point towards a relative melt down instead, and we'll act on it. Yes, the roller coaster markets are that tough to analyze for us these days.
Nikkei 225 61.8% retracement level is 13,980, about 650 points away. It's at the 200 day moving average resistance now.
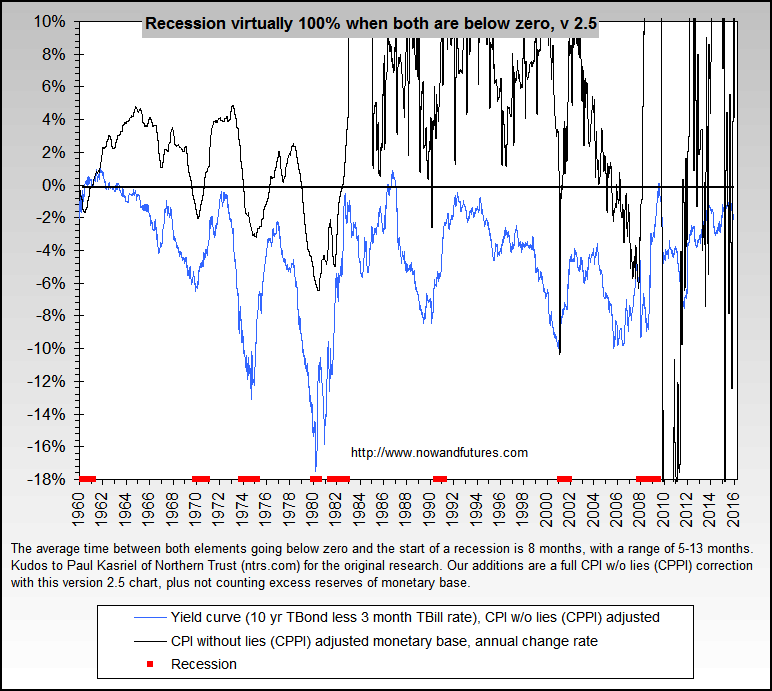
World recession update (external site)
Bear flag in silver and gold pointing towards more down moves. Our worst case scenario in gold is around $1150, silver around $19.50.
Update 4/21/2013 - 1970 average new car price $3,542, 2012 average new car price $30,748 (8.68 times higher), CPI New vehicle index 1970-2012 moved from 52.7 to 146.0, which is 2.77x. They're really over 3 times better?
Best guess on GDP Q1, to be released on Friday, is +2.1% minimum. Fully inflation adjusted, -1.9% maximum. GDP & real GDP since 1930.
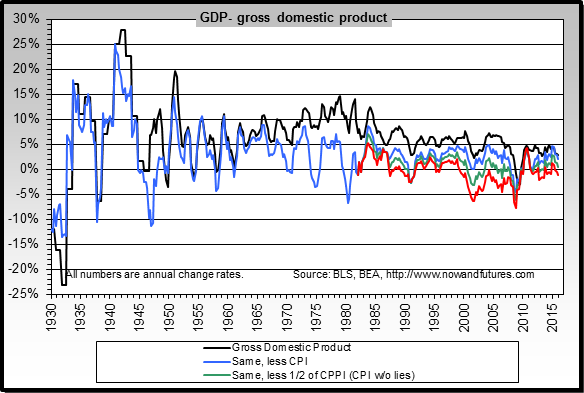
Debt doesn't matter - NOT
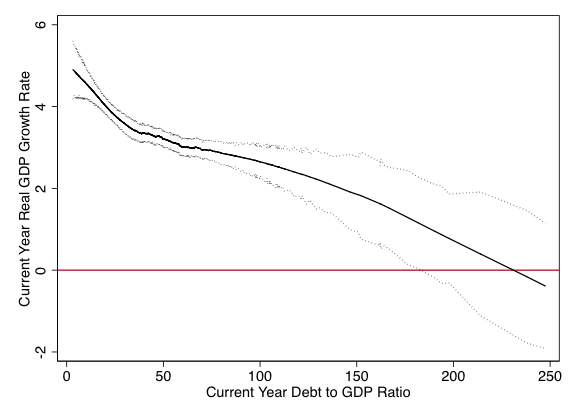
With all the noise and spin about how horrible the problems with Reinhart and Rogoff were, it's useful to observe that Herndon, Ash and Pollen also find lower growth when debt is over 90% (they find 0-30 debt/GDP , 4.2% growth; 30-60, 3.1 %; 60-90, 3.2%,; 90-120, 2.4% and over 120, 1.6% etc. as the above chart shows). The actual facts have been lost in the "PR spin"... and the result means that much more government debt around the world, since "it's OK now".
Beware the upcoming very large redefinition of GDP, due in July (GDP Q2). "Billions of dollars of intangible assets will enter the gross domestic product of the world’s largest economy in a revision aimed at capturing the changing nature of US output. ... takes into account 21st century components such as film royalties and spending on research and development." Source (translation: hedonics for GDP) It's due to a UN international standard.
Update 4/22/2013 - Gold & silver possible peak window during which to be very wary, best guess, April 26th-May 3rd.
Which way does the Fed want the S&P 500 to go? (duh, melt up apparently in progress)
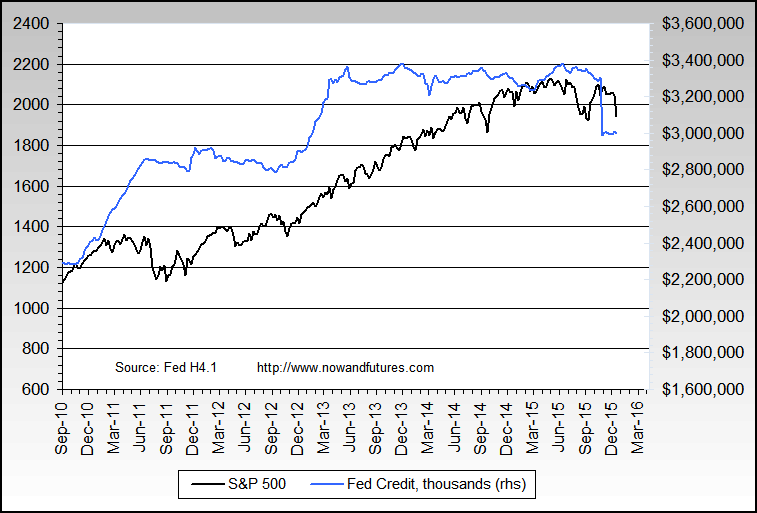
Lightened up on wheat longs, no particular reason other than a mild foreboding.
Blast from the past - rally time (flash file)
The ATA trucking index (non seasonally adjusted) was up 1.9% over last year, and the last ten months was up an average of 1.4%/month, but 1.4% is quite substantially lower than even CPI-U based inflation. In other words, trucking is down when inflation corrected with apples to apples comparisons.
Update 4/24/2013 - Lightened up again on wheat longs - short term rounded top(?). Down to under the initial position.
Durable goods came in just 1/2% above last year, same month. Nondefense Durable Capital Goods Excluding Aircraft (both NSA and SA) has been negative on an annual change rate basis since last June. Not bullish.
Update 4//2013 - The Mirage of Economic ‘Growth’ (Hedonics for GDP, the potential for 'abuse' is high)
Still long gold from about $1345 with a tiny position, long the S&P 500 as of earlier today too - melt up in progress. Added a small amount of miners and silver longs. Bad call on wheat sale yesterday, large move up today.
GDP - +2.48%, way below expectations. (-1.3% at best with full inflation correction estimate)
Exited S&P 500 and silver longs at a profit.
Update 4/26/2013 -
CPI surprise?...
4/13/2013We think that CPI will surprise to the upside next Tuesday.
Update 4/14/2013 - Fibonacci+ numbers on gold:
100.0 1923
76.4 1630
75.0 1612
61.8 1448
50.0 1301
38.2 1155
25.0 990
23.6 973
0.00 680
Fibonacci+, "the other way"
200.0 3167
176.4 2873
161.8 2692
150.0 2545
138.2 2398
123.6 2217
100.0 1923
"Technical analysis is a windsock, not a crystal ball." -- P. Arthur Huprich
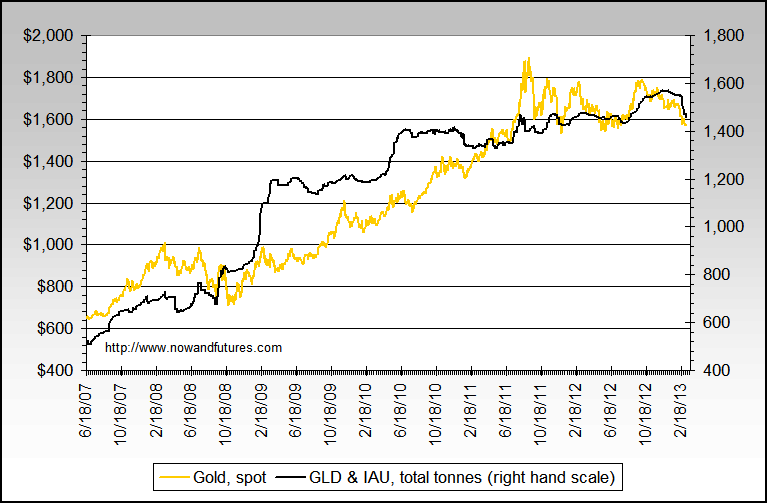
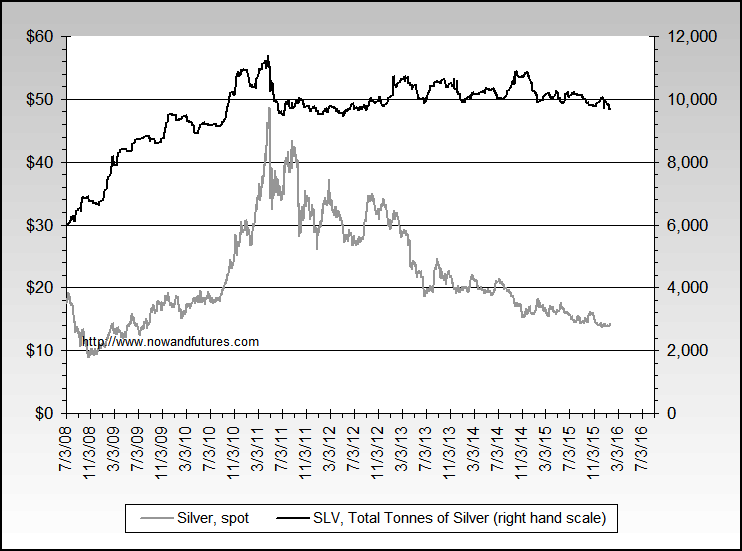
GLD plus IAU versus SLV, long term perspective in tonnes. SLV is much stronger, relatively.
GLD plus IAU
SLV
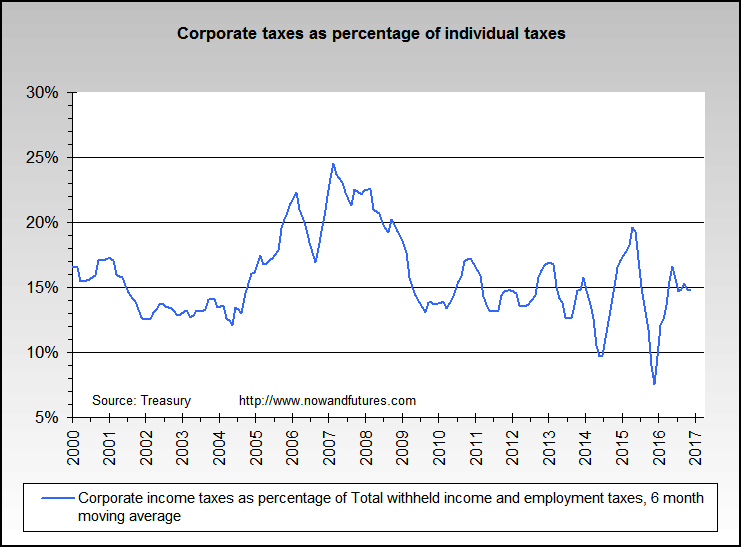
Corporate taxes as a percantage of individual taxes from our taxes page
Initial claims still on uptrend, barely
Update 4/15/2013 - By request, Fibonacci+ numbers on silver:
100.0 48.56
76.4 39.25
75.0 38.70
61.8 33.49
50.0 28.83
38.2 24.17
25.0 18.97
23.6 18.41
0.00 9.10
Update 4/16/2013 - Gold hits $1320, silver hits $22 overnight. Close enough, per best guesses. Now long with small position in both.
Oil also bottoms around $86, now over $88.
CPI-U comes in significantly less than our expectations at 1.5%, down from 2%. Consumer Purchasing Power Loss Index (CPPI) also lower at 4.7%, down from 5.4%. Housing starts and permits bullish, but oddly enough the S&P 500 futures has not responded very positively to either - yet.
Added again to wheat longs. Will add to silver on a clean break above 23.90 or so, another potential buy around 23.10.
Reinhart & Rogoff respond (quick answer: it doesn’t change the basic conclusions, debt DOES matter etc. etc.)("It is utterly misleading to speak of a 1% growth differential that lasts 10-25 years as small.")("On a cursory look, it seems that that Herndon Ash and Pollen also find lower growth when debt is over 90% (they find 0-30 debt/GDP , 4.2% growth; 30-60, 3.1 %; 60-90, 3.2%,; 90-120, 2.4% and over 120, 1.6%). These results are, in fact, of a similar order of magnitude to the detailed country by country results we present in table 1 of the AER paper, and to the median results in Figure 2.")
Regarding some of the comments about gold the last few days, "Those who did not see it coming now say its all over." Hat tip, Dr. W.
Update 4/17/2013 - For all the Wall St. analysts and similar who can't value gold, try the cost of production as a baseline and then add factors for the items at the bottom of this page entitled "Major reasons for gold price changes, in no particular order".
On the new proposed Chained CPI, it boils down to "likely that the current COLA fails to keep up with rising costs confronting elderly and disabled beneficiaries." (Source: Economic Policy Institute)
"... if accuracy were the only motive for changing COLA, it would be relatively easy to get a full, chained version of the index of prices faced by the elderly and use that. That has not been proposed."
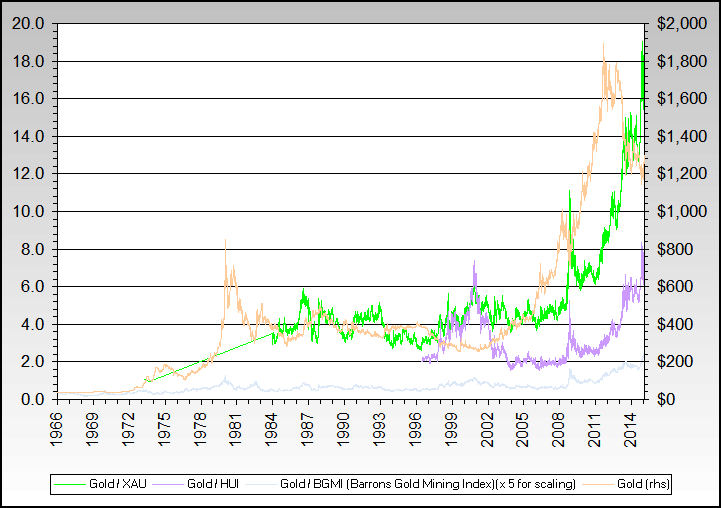
Close to record lows on all major mining index ratios to the gold price
Of the 27 days since March 11, the S&P 500 has only had 6 days when an up day wasn't immediately followed by a down day - aka, a roller coaster. And the market is virtually even over the period.
Please see our disclaimer at the bottom of this page
Took profits on some gold & silver longs, looks like chart painting, oil not confirming, DX up, etc.
Update 4/18/2013 - added to small position in miners, would go in big but for the risk of a big drop in stocks overall. Wrong last night on not continuing to hold all gold & silver longs, but risk management is key and the trade was profitable.
eBay price premiums have been substantial, silver eagles as high as 50%, 10 oz silver bars never dropped below $30/oz., gold eagles never dropped below about $1630 (premium high about 21%), etc.
Initial claims still climbing, Philly Fed lower than expected, oil price decline, PMI decline, CPI-U decline, L.A. and Lomg Beach container traffic down YoY, NAHB numbers not bullish three months in a row(same with NIHB and Intuit's), ASA staffing weak growth, Euro area recession, etc. all pointing towards an upcoming recession. We also do expect a final stock price gain before a recession starts.
A definite break below 1520-1525 on the S&P 500 will likely make us go short.
See our disclaimer at the bottom of this page
Update 4/19/2013 - Strong gold resistance in the $1450-1475 area.
More indicators showing slowdown and likely recession ahead:
- NFIB small business index down again
- Single family housing starts and new building permits down the second time in three months.
- Real estate loans at commercial banks slowing substantially on a year over year basis, last week only up 8/10th of 1%.
- ISM manufacturing index dropped to its lowest level since December.
- ISM non-manufacturing index declined to its lowest level since September.
- Retail sales down in March
- U. Michigan confidence Index down again
- Conference Board LEI down, third month in a row
NFP high variability, C-CPI...
4/7/2013Nonfarm Payroll Employment: Revisions between over-the-month estimates, 1979-present - a warning note for those who are reasonably confident that NFP employment is a good forecasting tool.
For those who believe that CPI does not significantly understate actual inflation, we suggest you talk to seniors who have lived only on Social Security for many years and find out their opinions, and actual experiences in maintaining stable standards of living (excluding unusual medical expenses).
Our work shows that the new proposed C-CPI-U as an inflation adjustment for Social Security recipients (replacing CPI-W) will decrease the payment adjustment by just under 1/2 of 1% (.43% average since 2000). The BLS on the C-CPI-U (key phrase - "The use of expenditure data for both a base period and the current period in order to average price change across item categories distinguishes the C-CPI-U from the existing CPI measures".)
We're still looking for a turn in stocks near the end of April, ideal date 23rd.
Truly excellent interview with Jim Chanos about fraud, cheating, incentives etc. - there is some small hope.
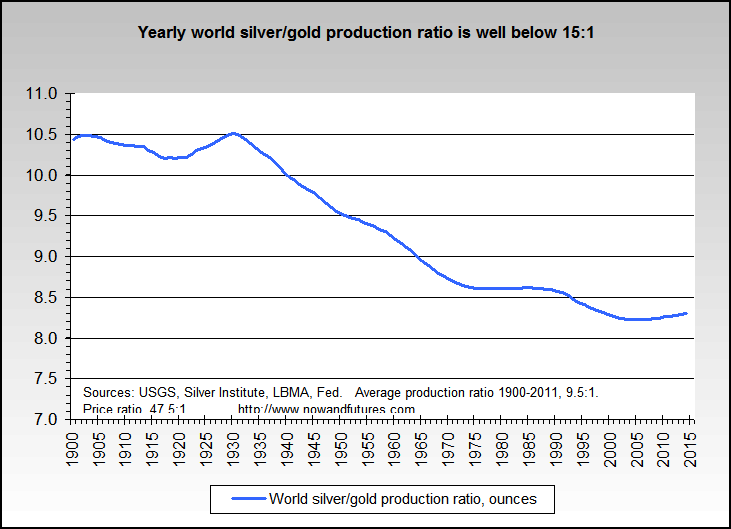
Update 4/8/2013 - Tell me again why the silver gold ratio is over 50:1 now, and it only went down to 15:1 during the peak in 1980? The actual silver to gold production ratio hasn't been above 10:1 since since about 1940, and not above 10.5:1 since 1900.
Added again to long wheat position. Stock turn ideal date, 19th now.
Update 4/9/2013 - S&P 1950-2007, "Sell in May and go away"
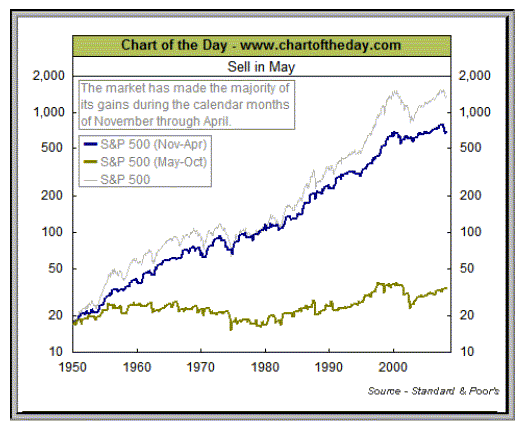
Real GDP (GDP less the official price deflator) has revised away the GDP drop in the 2001 recession HT shadowstats.com
Grant Williams on issues with lease rates and bullion banks (Youtube, about 39 minutes, From March 2013)
Will likely buy miners like the HUI on a solid close above 365.
Update 4/10/2013 - Two views on part timers: Part time employment as a percentage of total non farm employment, long term, and
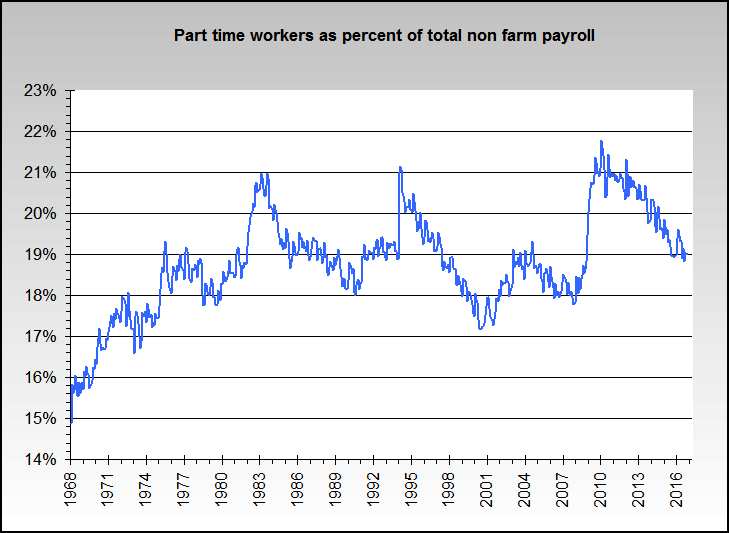
Part-Time for Economic Reasons, Could Only Find Part-Time Work, long term
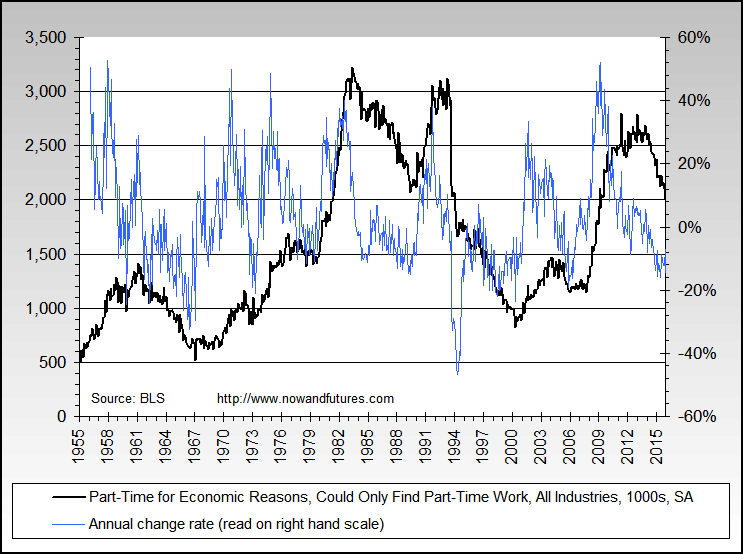
Bitcoin crashes from a high of 264 to about 150 (~40%)... so far.
Update 4/11/2013 - will be exiting half of long wheat positions and all of the S&P 500 long positions before the close. (exited 1/2 S&P longs on the break below 1581)
Bitcoin low so far, about $52. Best guess bottom around $39.
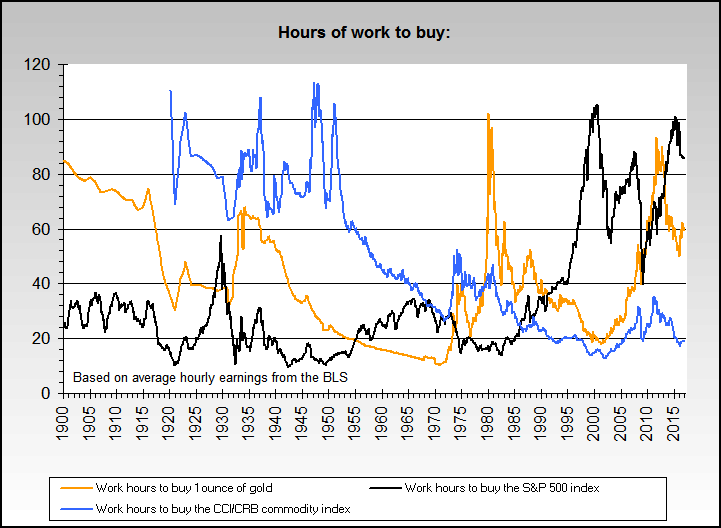
Work hours to buy...
3/31/2013Food is not getting cheaper
Gasoline is not getting cheaper
Work hours to buy gold, commodities and the S&P 500 index
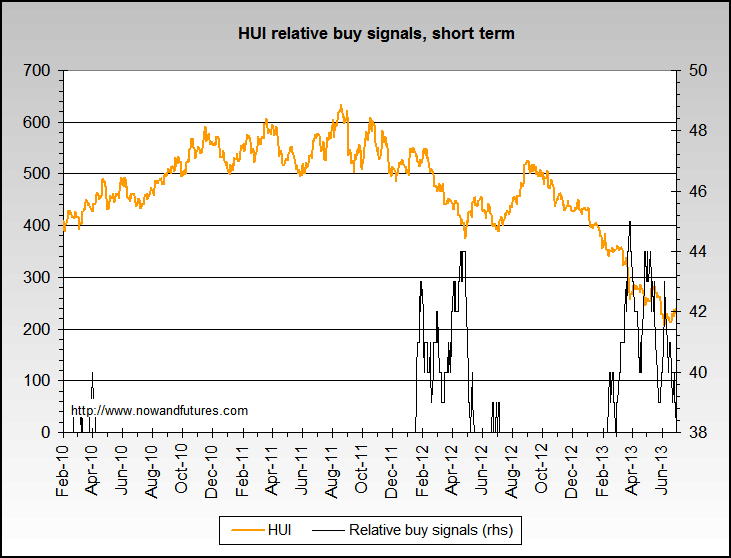
Mild and a bit risky buy signal on the HUI, will be buying some today.
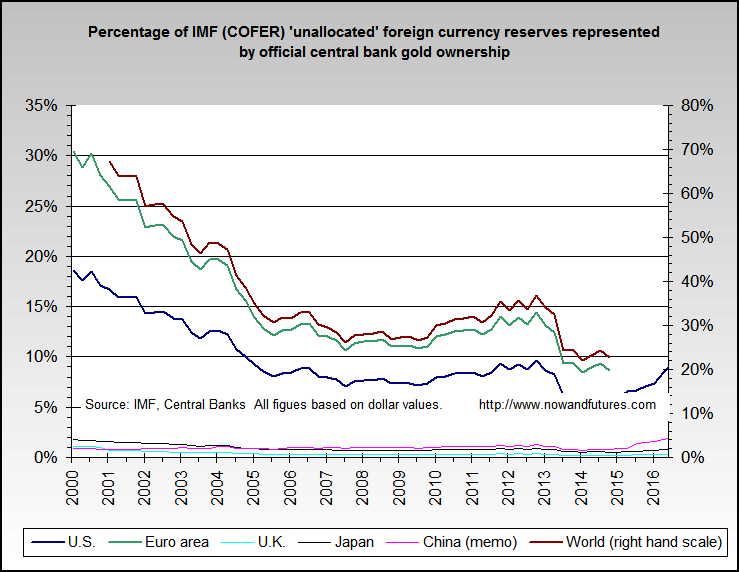
Percentage of IMF (COFER) 'unallocated' foreign currency reserves represented by official central bank gold ownership
Update 4/1/2013 - BitCoing going seriously parabolic - be extremely wary. Bypassing paper money is a good idea and it's part of what we foresee ahead, but we think it's way too early and that it won't end well. As an example, making it illegal to use Bitcoin for transactions is one way that it can be seriously affected by governments.
The number of homes overall in foreclosure or bank-owned rose by 9 percent to 1.5 million properties nationally in the first quarter of 2013 compared to a year ago, according to RealtyTrac.
21 graphs that show America’s health-care prices are ludicrous (WAPO)
Update 4/2/2013 - Small business index - total revenue (-.8%), retail sales (-4.3%)
Small business index - real estate, rental, leasing (2.7%, trending down since last June)
Small business index - employment (.3%), hours worked (-2.2%)
Small business index - accommodation, food services and drinking places (-3.7%), health care and social assistance (-1.9%)
All percentages are annual change rates
Update 4/3/2013 - Agriculture and drought wise, check out this archive of drought and compare today against last year at the same time. No guarantees as always, but the picture isn't terribly optimistic.
Initial claims potential uptrend continues...
Food for thought on gold - Thoughts on any rhymes or parallels between now and 1975-1976? Is it 9/75, 1/76 or 7/76 or something else? (7/76 is our best guess)
Best guess, HUI bottom in the 285-295 area,
Update 4/4/2013 - Google trends shows not much awareness or concern on a recession. It's still our belief that one will likely start around August. No guarantees or absolute certainties, as usual.
Just for fun... and a bit snarky on certain housing markets.
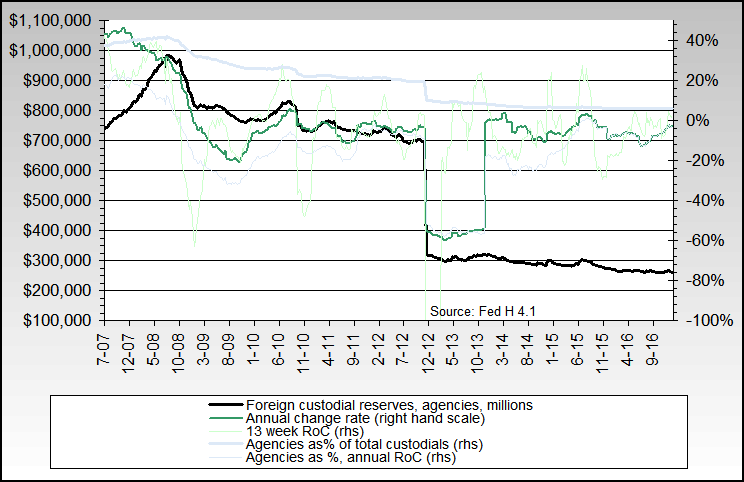
Fed agency custodials are falling, even after the November revaluation
Another small long in a miners via a mining stock mutual fund.
Update 4/5/2013 - Medium sized short added on S&P 500 based on seasonally adjusted non farm payroll disappointment (88,000, expectation of 190,000+). (will exit before the close, so that we don't carry an open position over the weekend).
Participation rate down again to 63.3% from 63.5%, which provided most of the odd result of the U3 unemployment rate going down to 7.6% from 7.7% (U6 down to 13.9% from 14.9%). Median duration of unemployment up to 18.1 from 17.8 weeks. Average (mean) duration of unemployment up to 37.1 from 36.9 weeks. Household survey showed a job loss of about 206,000. Government employees up about 75,000. source.
A slightly bright spot is that part time jobs were up on a relative basis, so our U7b unemployment rate reconstruction went down to 22.1% from 23.2%, but it's also affected a little by participation rate issues. Construction unemployment rate also down to 14.7% from 15.7%.
Debtors prisons are back
Central Banks Must Master Their Fear of Inflation, a probable picture of the future in our opinion
Economic Contraction Anyone? Anyone?
Full nuclear fusion tests this summer which would enable propulsion for 30 day trips to Mars(wow...)
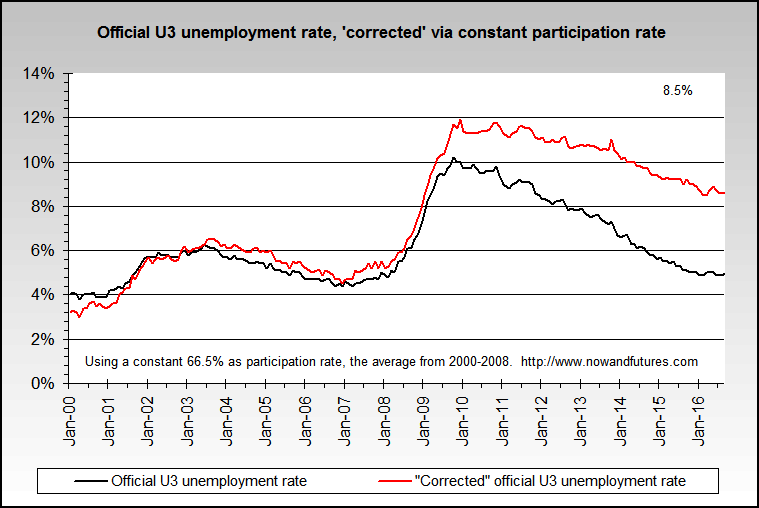
U3 unemployment rate, corrected for a constant participation rate since 2000.
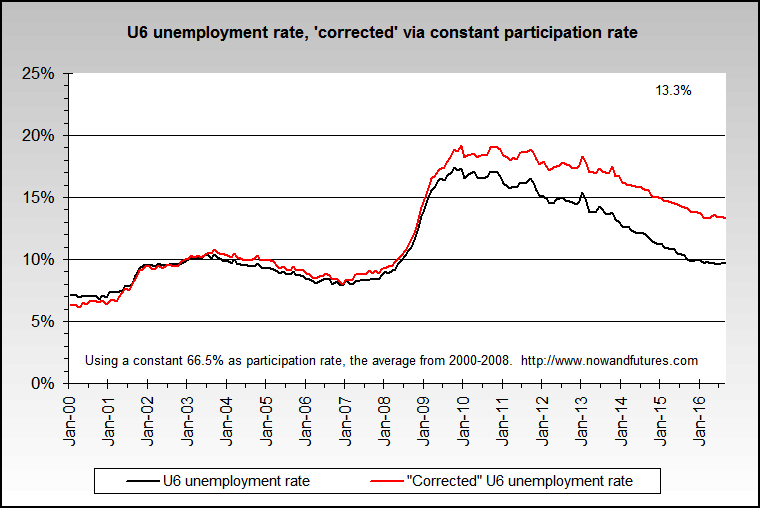
U6 unemployment rate, corrected for a constant participation rate since 2000.
U7 unemployment rate, corrected for a constant participation rate since 2000.
The huge jump in our M3 reconstruction was due to a very unusual increase in repos, and will probably disappear next week.
Inflation, various...
3/23/2013Large jump of BPP CPI above BLS CPI (http://bpp.mit.edu/usa/)
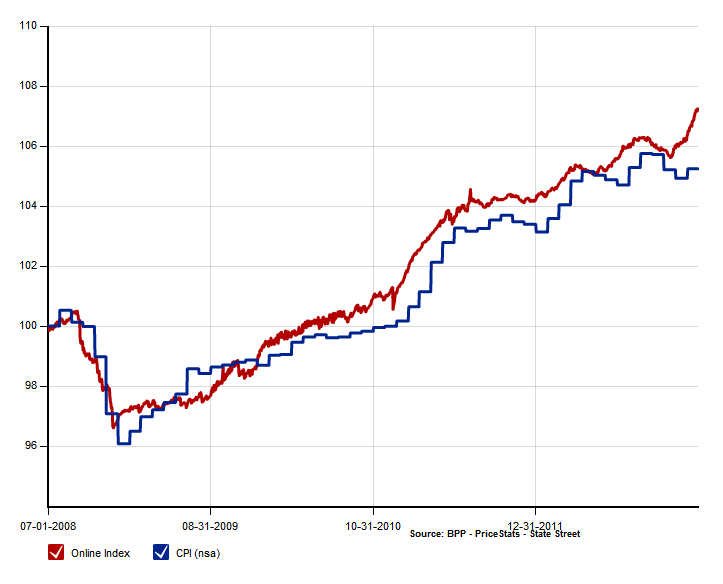
World CPI from IMF, including emerging countries
The real NAR Housing Affordability Index, CPI adjusted
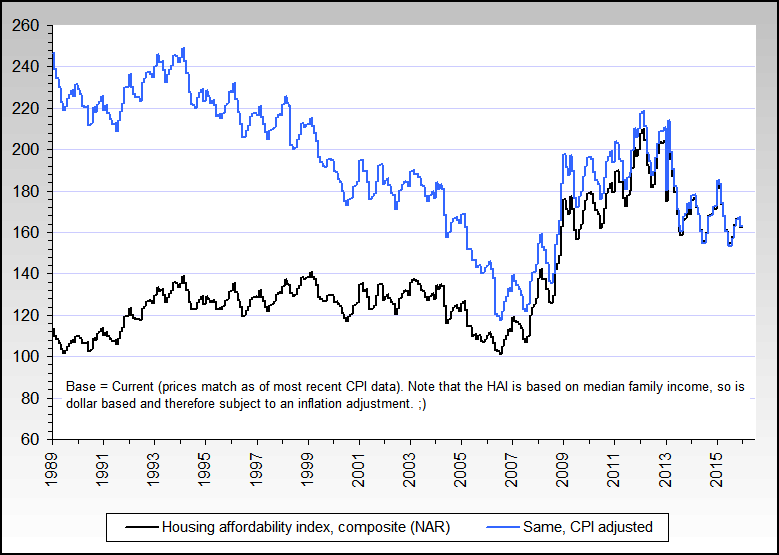
Palladium, the forgotten metal
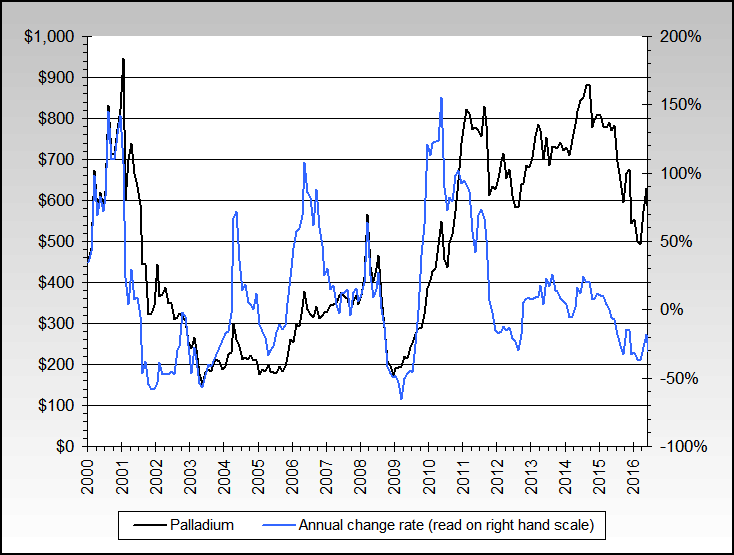
An odd viewpoint from a friend, we have actually had hyperinflation in U.S. stocks since 2009, per the IASB definition (26% per annum compounded for three years in a row).
Update 3/24/2013 - The Cyprus situation seems to have undergone some (at least partly) successful can kicking. We're mildly long the S&P 500 again, and we're up about 5 points.
Interesting take: Cyprus caught in proxy war between old enemies
Update 3/25/2013 - No movement, S&P flat for too many hours - we're out.
Some perspective, annual costs as of December 2012:
Disability - $128.7 billion to about 8.8 million people ($14,625/year average)
Food stamps - $81.4 billion to about 47.8 million people ($1,703/year average)
Veteran's benefits - $74.5 billion to about 22.7 million people ($3,282/year average)
Federal unemployment - $67.3 billion to about 5.8 million people ($11,603/year average)
Medicaid - $427.8 billion
Medicare - $572.9 billion
Social Security - $653.2 billion to about 48.1 million people (excludes disability)($13,580/year average)
Update 3/27/2013 - Price per BTU, various energy sources, long term
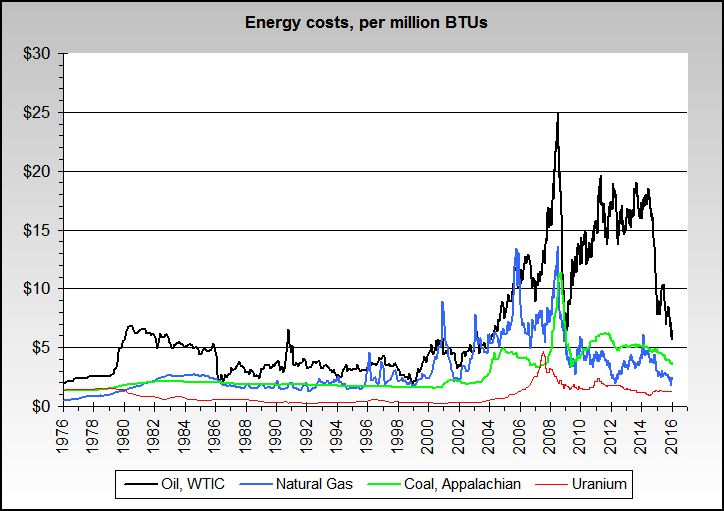
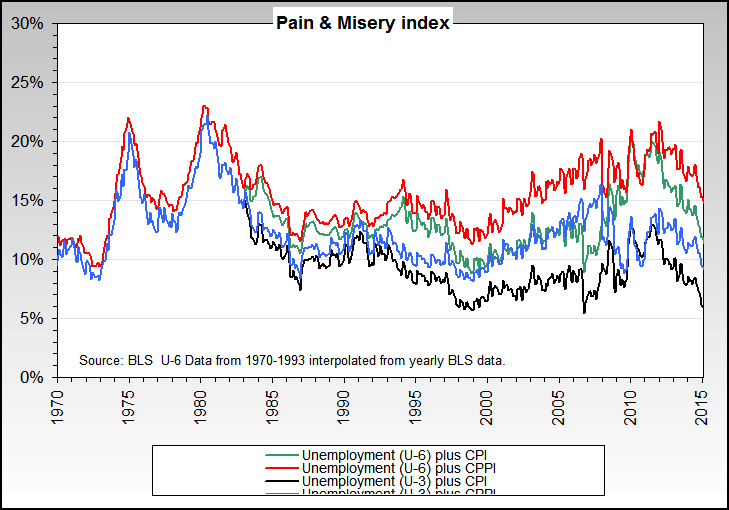
Pain misery index
The new BRICs - MeSSA (Mexico, Southeast Asia, Australia)?
VIX, etc...
3/16/2013For what its worth, the all time low in VIX was 9.31 around Christmas 1993 --- and the stock markets moved virtually zero until early 1995.
VIX was also mostly between 19 and 25 during the stock market peaking process in late 1999 to mid 2000.
And it was mostly between 10 and 15 during the stock market peaking process in mid/late 2006 to the first top in July 2007.
Update 3/17/2013, 8PM Eastern - who knows?, but the current issue of an haircut in Cyprus doesn't seem to us like substantial financial contagion will result. Confidence in banks, etc. is a different story as is insurance in the form of hard assets. (add: "template" is the key word)
Update 3/18/2013 - NAHB Housing market index down to 44 from 46. Present conditions index down to 47 from 51. Traffic up to 35 from 32. Next 6 months up to 51 from 50. Any number under 50 indicates that more builders view sales conditions as poor than good.
Update 3/20/2013 - Long the S&P 500 again, the Cyprus cans have been kicked down the road. Considering long wheat at around 7.15, drought still exists. Rice may be bottoming. In an extremely unusual set of events, our next expected turn point has moved from late March to late April.
Update 3/21/2013 - Long wheat, small position. Watching S&P resistance around 1542. World trade index not looking very good 1:28 PM Eastern, exited S&P longs at a profit - too much volatility for now.
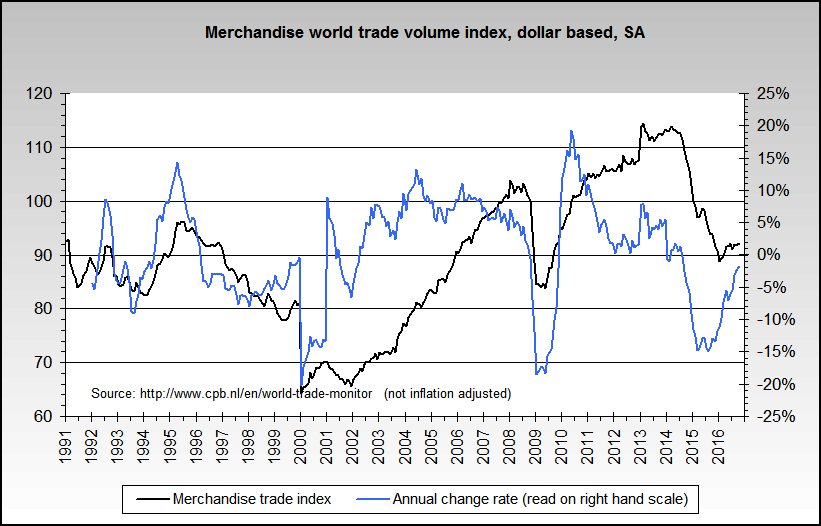
Philadephia Fed, CFNAI and recessions - the smoothed annual rate of change of the Philadelphia Fed current activity index has been negative for 4 months in a row.
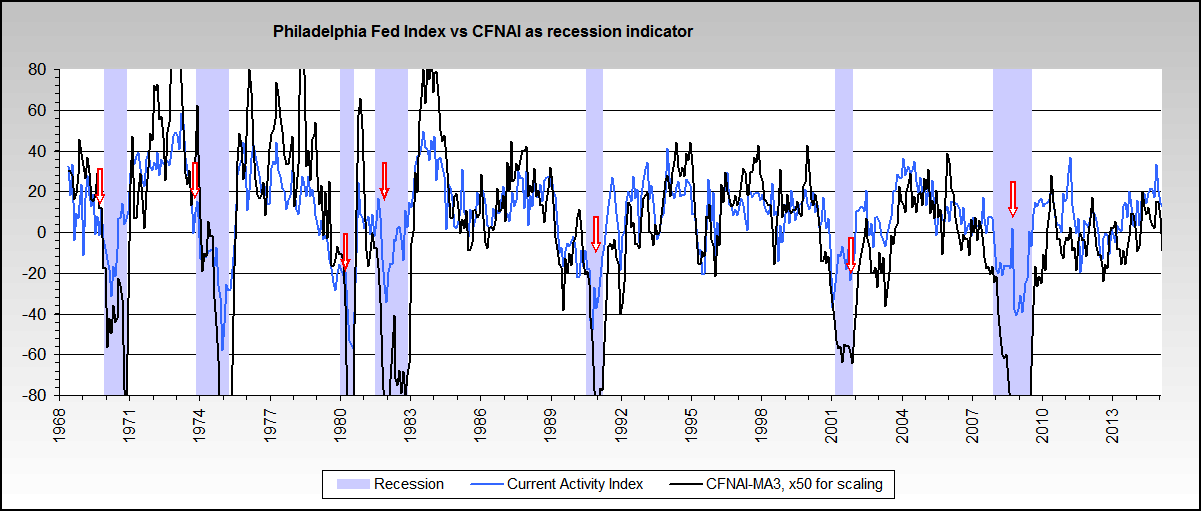
LEI - coincident to lag ratio and recessions
Irony of the day "1/18/2008, Trichet: "For a small, open economy like Cyprus, Euro adoption provides protection from international financial turmoil." (HT: ZH)
Update 3/22/2013 - Initial claims potential uptrend?
Lots of 'noise' about the drop in federal spending, based on budget expenditures... which completely all ignore off budget expenditures
Actual growth of total federal debt (not just public debt as Krugman and other spin/PR based people use to mislead), which shows continual growth even though the annual rate of growth has been dropping. Current yearly growth rate, about 7.5% (not austere).
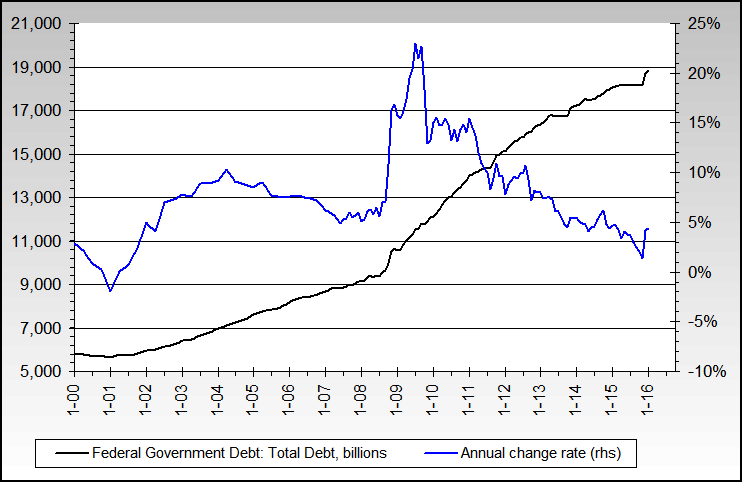
Deleveraging...
3/9/2013Deleveraging is dead.
.jpg)
Looking forward:
Currency +7.7%, M1 +10.1%, M2 +6.9%, M3b +6.4%, Z1 total credit +3.1%, total mortgage debt +3.1%, total Federal debt +7.5% (public sector +7.2%), total state & local debt +.2%, Fed's System Open Market account (86% of their balance sheet) +9.4%. All are annual change rates.
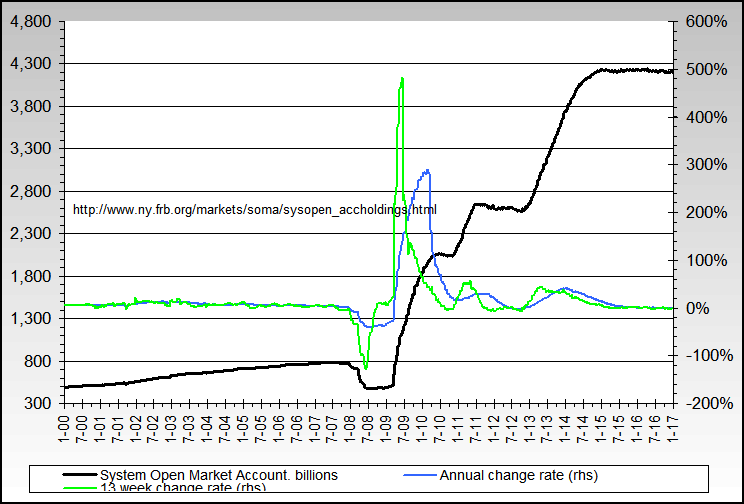
Velocity is level to slightly up (red line).
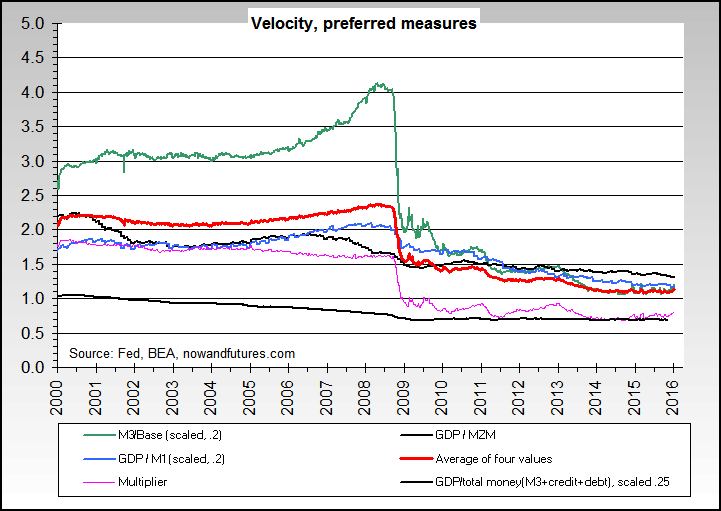
Conference Board Consumer Confidence Inflation Rate Expectation 12-Month Hence +5.5% (CONCINFL:IND), ECRI future inflation gauge 5.1%. Both ISM prices paid are around 61.6. Real GDP per the BEA hovering just above zero growth. Consumer Purchasing Power Loss Index
Stagflation (will be)(is) alive and well, take your choice.
Update 3/13/2013 - Retail sales up, but most of it is due to higher gasoline prices per the WSJ. NSA retail sales also up only 1.2% (SA up 4.6%) - subtracting only CPI-U inflation shows an actual apples-to-apples drop in retail sales.
Update 3/14/2013 - Inflation targeting at the Fed's current target of 2.5% per year causes prices to double in 29 years (36 years for 2%). PPI release today shows increasing inflation ahead. Unemployment claims trend continues to reflect significantly more part time jobs to full time jobs ratio.
Suez could be a problem in the next few weeks?
Update 3/15/2013 - CPI-U 1.98% (annualized 8.16%), Core CPI 2.00%, Cleveland Fed median CPI 2.2%, CPPLI (Consumer Purchasing Power Loss Index) 5.74%.
As usual, exiting most S&P longs for the weekend.
Small business Intuit indexes trending down...
3/4/2013Small business index - total revenue, retail sales
Small business index - real estate, rental, leasing
Small business index - employment, hours worked
Small business index - accommodation food services and drinking places, health care and social assistance(NEW)
Update 3/5/2013 - 7:34 AM Eastern, ISM services will come in "hot", new all time highs, we're long the S&P.
9:01 AM Eastern, ISM non-manufacturing all green but not as hot as we expected. It "should" be enough for new all time highs today or this week. Note also that both ISM prices paid indexes are up again.
Update 3/8/2013 - will be exiting S&P 500 longs before close.
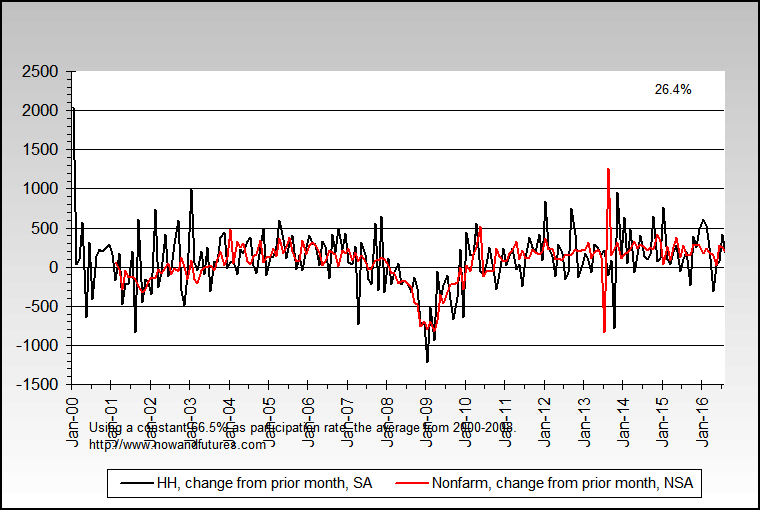
The non farm employment (establishment) survey shows about 2.2mm job gains in the last year. The household survey, from which the unemployment rate is calculated, shows about 1.5mm job gains in the last year.
U7b unemployment down to 23.2% from 23.7% in January (22.8% in December).
Non farm employment +236k, participation rate down .1 percent which is equivalent to ~135k, which makes the net added +101k... and the birth/death model added 97k (SA).
Household survey employment +170k, usually work part time (LNU02600000) +291k - some quite significant full time "conversions" to part time.
Part time employment substantially up as a percent of total non farm payroll
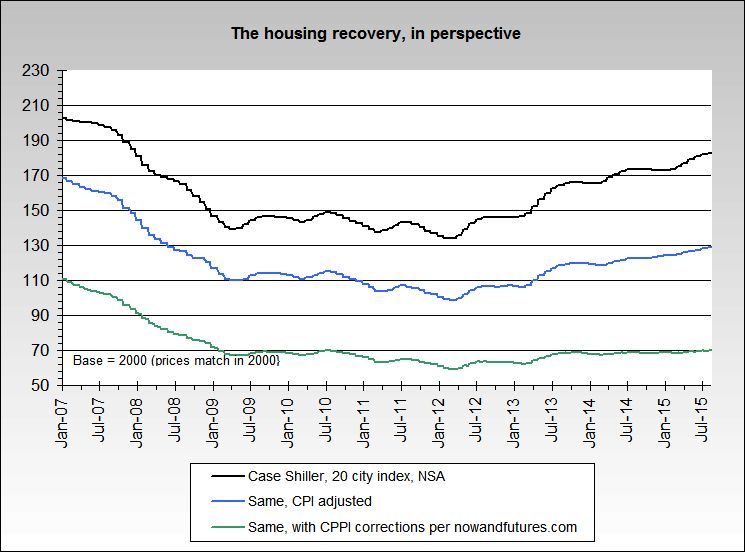
Housing "recovery"...
2/24/2013Housing prices, still lower lows and lower highs with just a CPI-U correction (same chart but including our CPPLI)
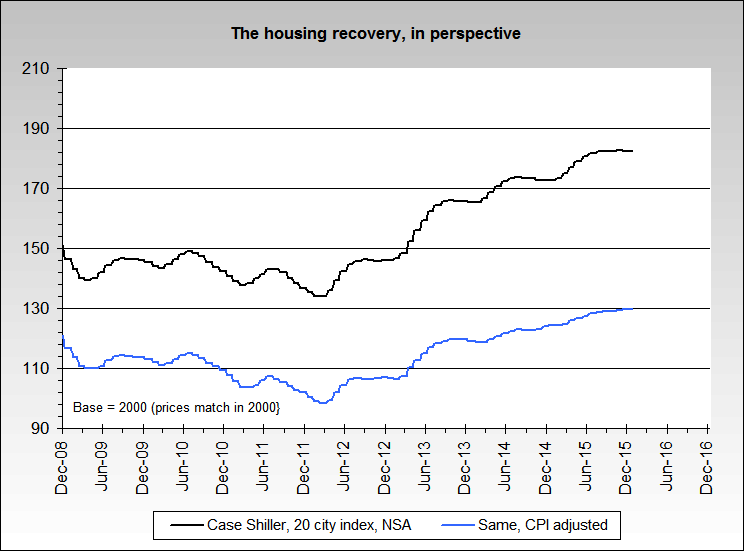
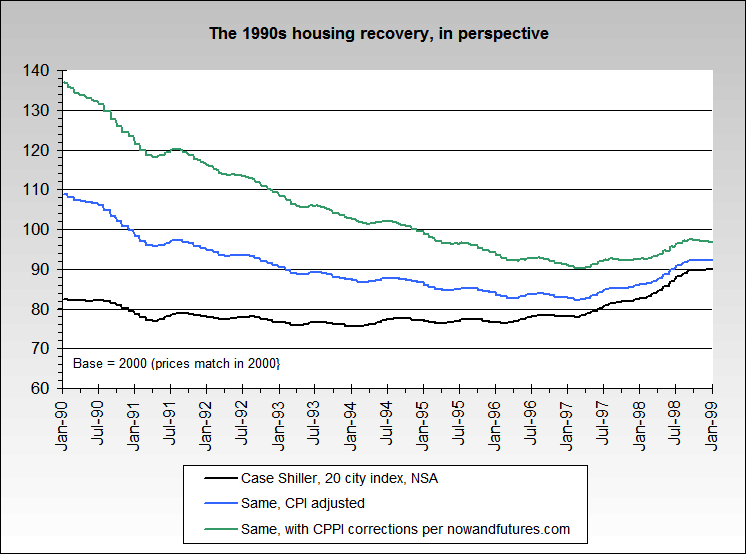
The 1990s housing recovery, a similar path to what we believe is occuring
Update 2/28/2013 - best guess after checking the tea leaves, gold bottom around March 23 if not sooner.
Top signal...
2/17/2013Fairly reliable (proprietary) S&P 500 top signal has fired. We're on the alert for an entry point.
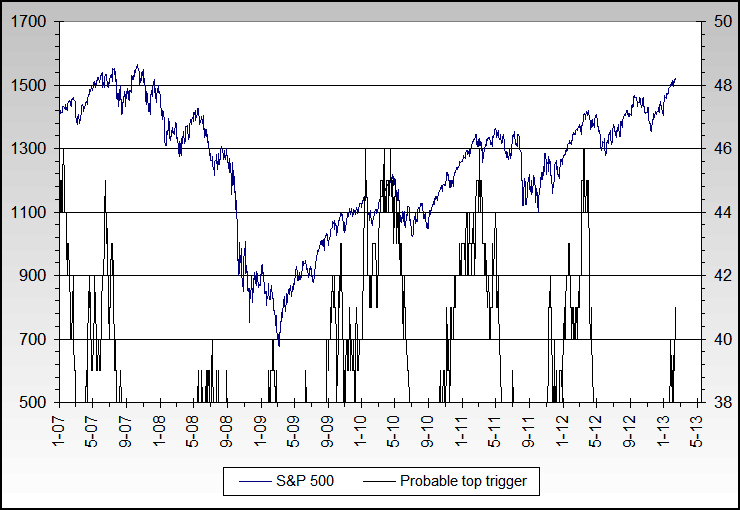
Update 2/20/2013 - Short the S&P 500 as of this morning, small position (will be watching the last 30 minutes of trading for a possible exit based on "Buy the dip" thinking, or do a position add). Gold & silver options expirations is next Monday, Feb 25th. We expect at least a temporary bottom.
Update 2/21/2013 - Initial target on S&P 500 short, 1480-90.
10:35 PM EST, took profits on 2/3 of the S&P short position.
Update 2/22/2013 - 6:50 PM EST, took rest of profits on the S&P short position. There is resistance around 1515, and we may re-enter the short on Monday morning.
The week ahead...
2/10/2013In spite of 3 out of 9 of our primary indicators pointing bearish, we're still long the S&P.
Is TARP disappearing from Washington's memory?
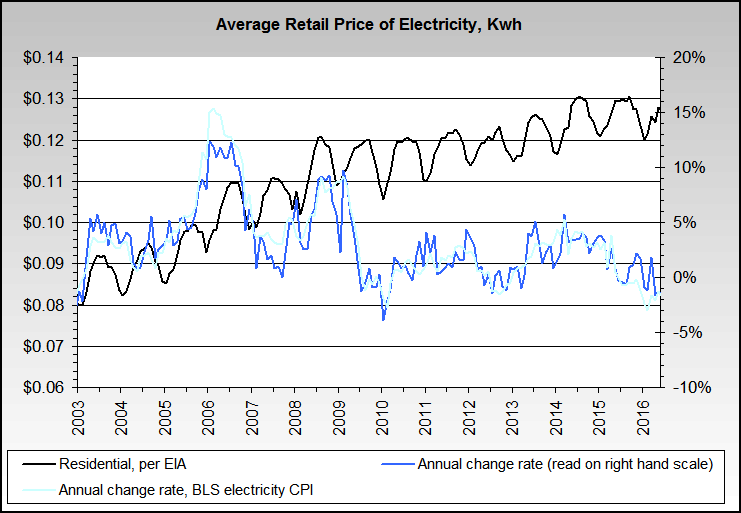
Update 2/12/2013 - The BLS CPI calculations and data for electric costs and inflation mtach up quite well
Update 2/15/2013, 2:16 PM EST - Bad Wal-Mart sales and 3 day weekend, exited S&P longs
Bitcoin is quite speculative and we're not going there due to the high likelihood of government control, crippling laws, etc.
Gloom & doom...
2/3/2013As much as we dislike politics or propaganda or emotion based spin type areas, we've noticed over the last year or so that the attacks on and emotion based spin about those perceived to be in the "gloom & doom" camp have greatly increased. The word "conspiracy" is also used much more frequently to describe those who are pessimistic. Our very strong preference is for realism, as opposed to optimism or pessimism.
In at least partly a tongue-in-cheek based opposing viewpoint, perhaps the other side of "gloom & doom" should be called "Pollyanna Porn", "All good, all the time, no matter what", "Ossified Optimists" or "To the moon, Alice"? Equal rights, after all... [wink].
In the various markets, strong positive sentiment, whether fact based or not, continues to point to higher stock markets around the world, with smaller relative gains for hard assets like precious metals. We're long the S&P 500 - in our 'submissive' culture.
There's no inflation here! (asset inflation, simple) Sadly, it is 'trickling down', as in stagflation.
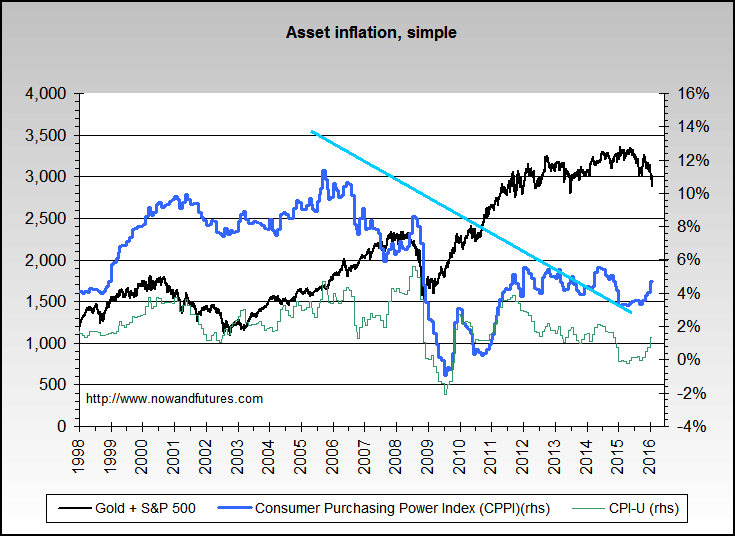
Defense spending since 1980
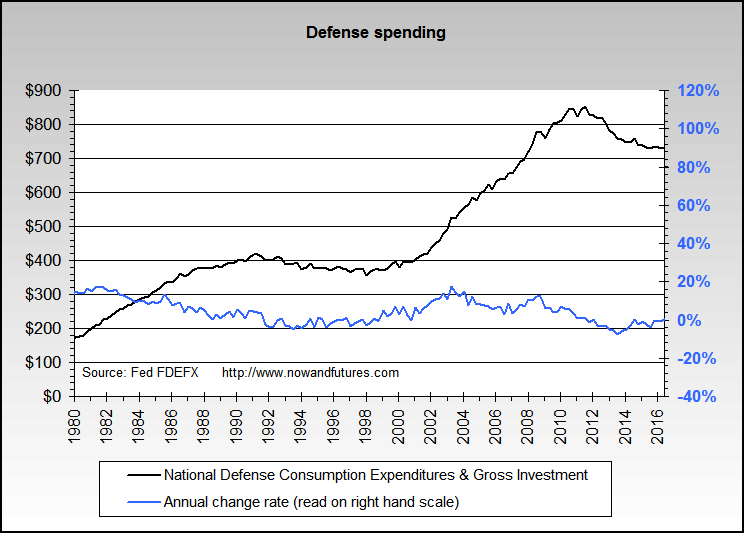
Household employment, alternate
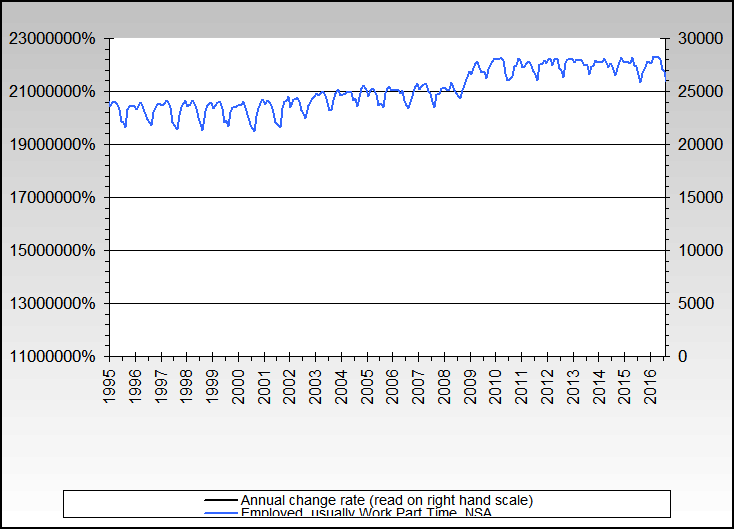
Small business index - total revenue, retail sales
Small business index - real estate, rental, leasing
Small business index - employment, hours worked
Huge increases in health insurance costs, per the BLS
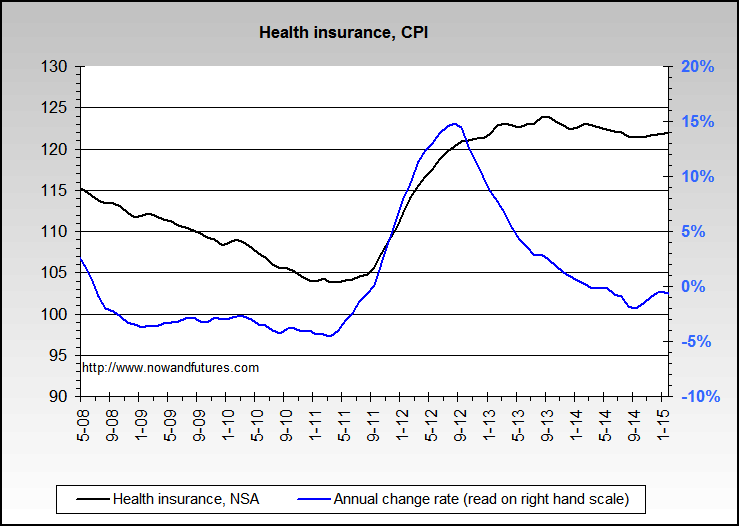
Update 2/7/2013 - Small indicators of a short position potential developing. Many items besides major indexes are down, the BKX being a primary one. Various short term monetary indicators are also flashing bearish. If tomorrow is down, we'll be exiting all long stock positions.
Update 2/8/2013 - Gold price & inflation trivia: 1869 peak in nominal dollars, $162. With a CPI-U correction to convert to 2012 dollars, that's $3,400. With our Consumer Purchasing Power Index (CPPI), it would be about $8,100.
Irrational exuberance, CYA...
1/27/2013"The market can stay irrational longer than you can stay solvent."
-- John Maynard Keynes
Recession prediction, how long a lag and is a one month only signal a real signal?
Next turn in the markets, best guess, is late April/Early May - the classic 'go away in May'. And again, in our opinion gold has not peaked - our since 2005 $3200 minimum gold target is still in effect.
"When I despair, I remember that all through history the ways of truth and love have always won. There have been tyrants, and murderers, and for a time they can seem invincible, but in the end they always fall. Think of it. Always.
-- Mahatma Gandhi
Update 2/1/2013 - Some unemployment stats:
U3 up to 7.9% from 7.8%
U6 up to 15.4% from 14.7%
U7b up to 23.7% from 22.8%
Nonfarm payroll + 157k
Part time for economic reasons +198k
Unemployed usually part time -35k
Participation rate stable at 63.6%
Household survey +17k, or -351k from the alternate household survey
Construction unemployment rate up to 16.1% from 13.5% in November, down from 17.7% last December
Awaiting long opportunity...
1/21/2013After the next significant S&P 500 correction, we expect to go long (leveraged?) on it and other items. The trends of new money creation are too much to let pass without action.
Update 1/23/2013 - Asset inflation against CPPI, 1998 to date
Update 1/25/2013 - Stand by on recession timing, as noted last month. Our recession prediction indicator has fired but it has a lag component - we're working on it.
Higher inflation ahead likely...
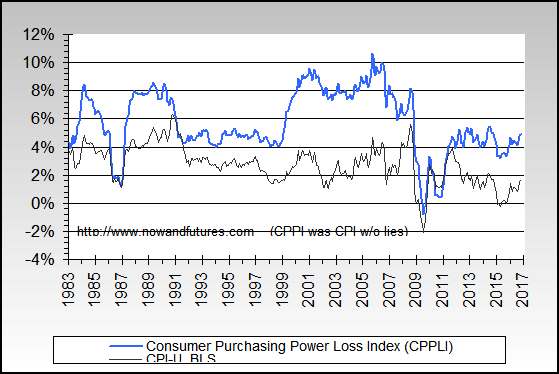
1/13/2013CPI-U vs. our CPPI - notice the leading character of our CPPI CPPI article
Total U.S. annual money supply growth: Currency & coin +9.1%, M1 +11.5%, MZM +8.3%, M2 +8.2%, M3b +6.6%, U.S. total credit (Z1) +1.5%, U.S. federal debt +8.0%.
Combined U.S. total money supply growth (M3b + all credit + Fed, state & local gov't debt, less double counting estimate) is +4.5%. As of September 2012, it was minus .4%.
For comparison, other countries or areas M3 equivalent annual growth rates - China +14.5%, Japan +2.1%, Euro area +3.3%, England -2.1%.
Fed custodials...
1/6/2013Huge drop in Fed custodials, agencies (due to revaluation of MBSs in mid November) Same chart, log based
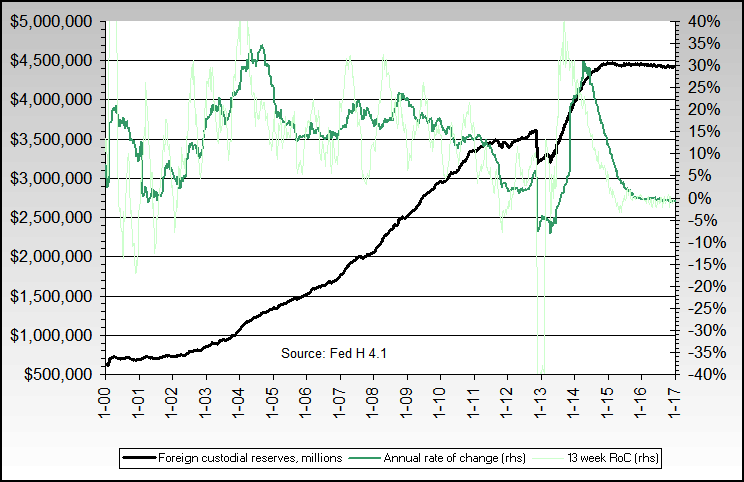
Perspective: since the start of QE1 on Nov. 25, 2008, the 10 year Treasury is down 1.18%, the 30 year Treasury is down .52%, the 30 year mortgage rate is down 2.75% and the S&P 500 is up 609 points.
Update 1/7/2013 - More perspective, this time on total money supply growth (all, annual growth rate): Currency & coin +8.7%, M1 +11.5%, M2 +8.7%, M3b +6.7%, U.S. total credit (Z1) +1.4%, U.S. federal debt +8.0%, Total world derivatives +9.7%. Top 5 central banks balance sheet growth - +11%.
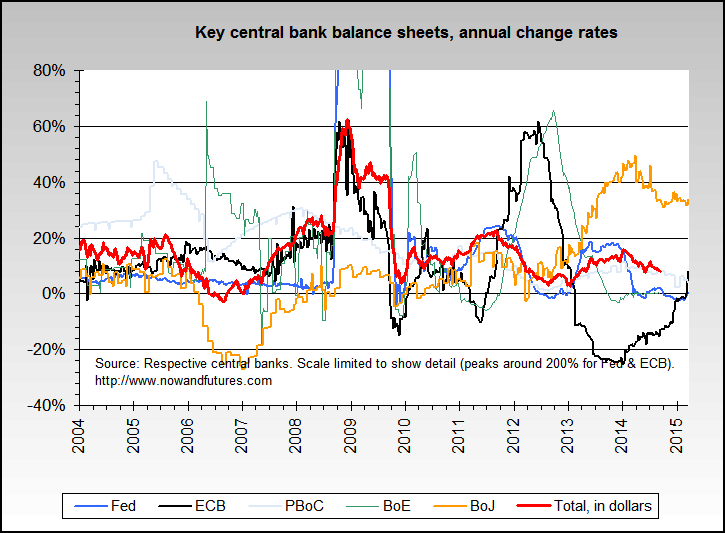
Lead and crime (HT MotherJones.com)
.gif)
Lead and pregnancy (HT MotherJones.com)
.gif)
Update 1/9/2013 - US energy self sufficiency level since 1973 Peak Cheap Oil is alive & well
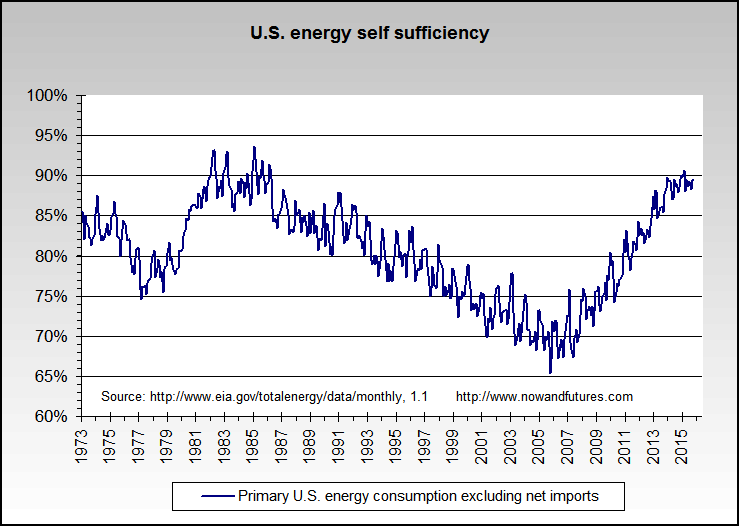
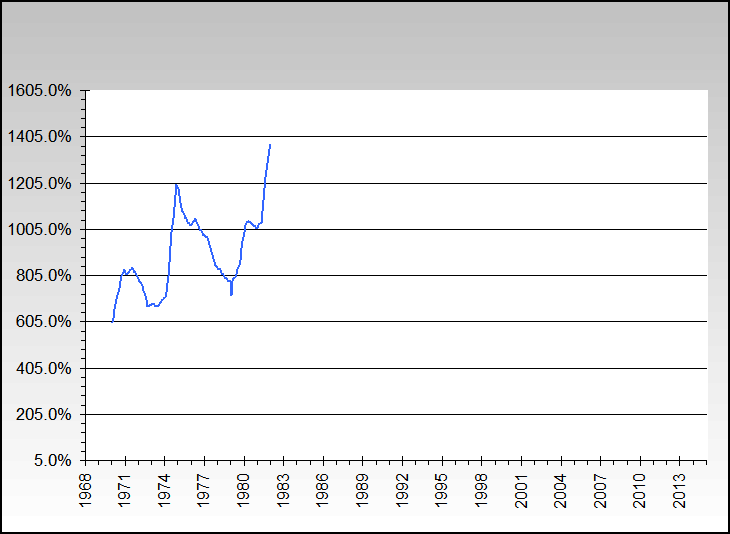
Gold, 1975-77, showing the bottom and chart patterns for other TA folk.
Taxes etc...
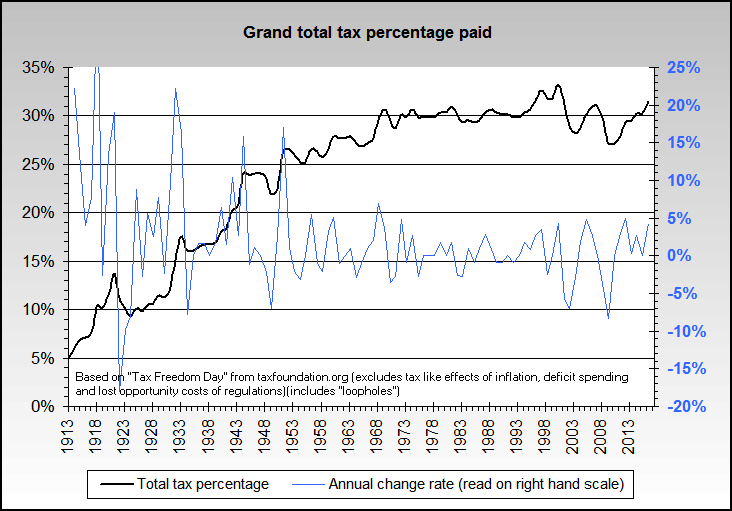
12/29/2012The total US tax burden (all levels of government plus fees and other charges) is far from an historical low.
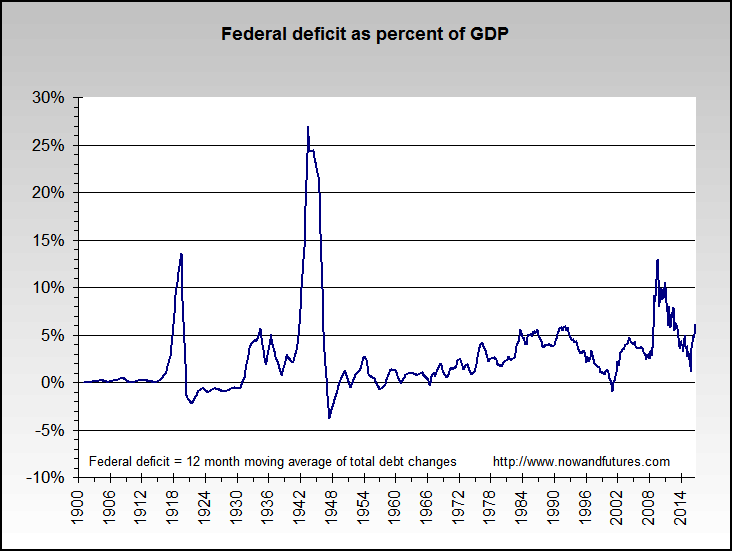
Federal deficits ratio to GDP - we're still ina record high range.
Update 12/30/2012 - A large trend, and part of the reason that the unemployment rate is dropping while the country isn't doing very well in the standards of living areas, etc.Part time workers as percent of non farm payroll
Part time workers as percent of total population
Japan in deflation = horse puckey or spin. Prices, per their CPI, are virtually identical now to what they were in the early 1990s.
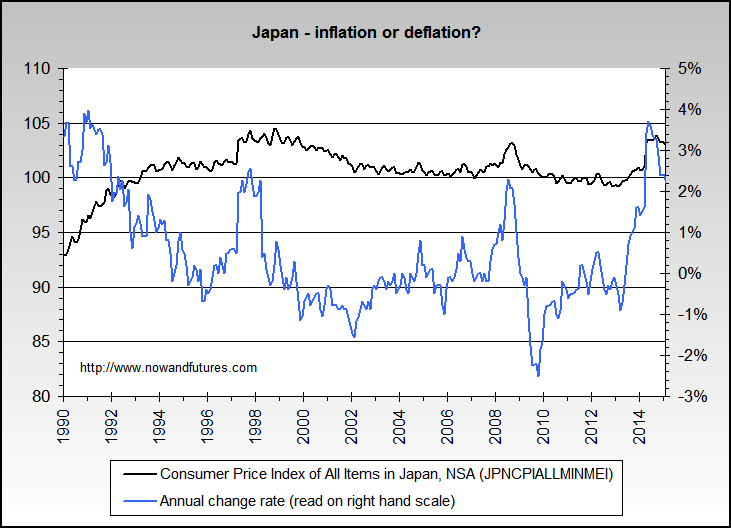
Cool & hot word of the week: cremnophobia (fear of cliffs)
Update 12/31/2012 - Happy New Year, and in spite of everything we wish you a better year than 2012 was!
Snarky & silly quote of the day:
"What's the use of happiness? It can't buy you money."
-- Henny Youngman
Update 1/2/2013 - Partly tongue in cheek, our conservative prediction for the gold price on Dec. 31st 2013 is $1913.
Update 1/3/2013 - Next market turn point estimate, Jan 16-17.
Watching wheat prices patiently for a break of the down trend since last July, which steepened in December.
Update 1/4/2013 - Weekly charts will not be uploaded by the normal Friday afternoon period. They should be updated no later than Saturday evening.
There is no such thing as a conspiracy.
Sincerely yours,LIBOR trader, 2011,
Bernie Madoff (Ponzi scheme, 1992-2008),
Bernie Ebbers, Worldcom, 2005,
Samsung & Hynix & Infineon, DRAM price fixing, 2005,
President Bush, "WMDs are definitely in Iraq", 2002,
Enron and Arthur Andersen, 2001,
Jack Abramoff, casino lobbying,1995-2004,
Savings & Loan executives, various, 1990,
Ollie North, Iran-Contra 1981-85,
President Richard Nixon (missing tape recording sections during Watergate, 1974),
Daniel Ellsberg, Pentagon Papers, 1972,
Secret bombing of Cambodia, 1969,
Reichstag fire, Berlin 1933,
etc.
Big perspectives and thoughts
Major reasons for gold price changes, in no particular order:
- Limits in supply, "peak cheap gold"
- Changes in demand (investment, jewelry, manufacturing, central bank etc.)
- Inflation direction & speed of change
- Real interest rate direction
- Fear - social, political, "financial system", peer pressure, safe haven
- Pain & Misery index (unemployment plus inflation rate)
- Changes in confidence of money or a given currency or the "financial system" (..."gold is simply the reciprocal of the world's faith in the institution of managed currencies. It is one divided by T, where T stands for trust." - James Grant, Barrons, Sept 2011)
- Manipulation/control/intervention by central banks and others
- Mania
- Technical analysis factors
- High general volatility
Another take: Fundamental Drivers of the Gold Market
Some of the major ways the whole world wide economic and political issues could play out, in no particular order:
- Inflationary or hyperinflationary depression, aka very significant stagflation
- Deflationary depression
- Debt restructuring
- "Rescue" by the IMF, BIS & World Bank (or similar institutions) involving a new world currency etc.
- "Debt jubilee", partial or not, and including an all consumer government bailout in order to pay down debt.
- Wars of varying sizes, and not necessarily involving guns and shooting
- Large population decreases, due to disease, weather events, energy and/or food shortages, wars, or other Malthusian issues.
- "New World Order" - oligarchy, fascism, corporatism, kleptocracy, etc.
On the brighter side: - Energy breakthroughs
- True leaders and statesmen emerge
- "Age of Aquarius" factors, in other words very unexpected positive changes - aka, "white swans"
And obviously, various combinations of the above.
"The Banks must be restrained, and the financial system reformed, with balance restored to the economy, before there can be any sustained recovery."
Jesse
Full text:
"A credibility trap is a condition wherein the financial, political and informational functions of a society have been compromised by corruption and fraud, so that the leadership cannot effectively reform, or even honestly address, the problems of that system without impairing and implicating, at least incidentally, a broad swath of the power structure, including themselves.
The status quo tolerates the corruption and the fraud because they have profited at least indirectly from it, and would like to continue to do so. Even the impulse to reform within the power structure is susceptible to various forms of soft blackmail and coercion by the system that maintains and rewards.
And so a failed policy and its support system become self-sustaining, long after it is seen by objective observers to have failed. In its failure it is counterproductive, and an impediment to recovery in the real economy. Admitting failure is not an option for the thought leaders who receive their power from that system.
The continuity of the structural hierarchy must therefore be maintained at all costs, even to the point of becoming a painfully obvious, organized hypocrisy."
Jesse
Prior years blogs
2012
2011
2010
2009
2008
2007
![]()