Energy - longer term picture
Crude oil 1861-2002
(Note the early '80s peak of over $80 when inflation is taken into account)
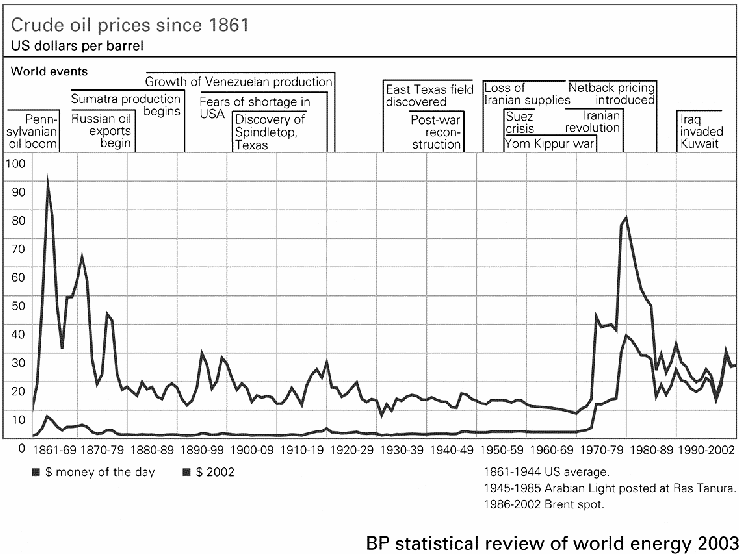
Source:British Petroleum
There were two OPEC official price hikes in the '70s, October 20th 1973 about two weeks after the Yom Kippur war started when it went from about $8.80 per barrel to $13.54, and the second in January 1974 when it increased to $38.07 per barrel. Those prices were for "Saudi light" and were not necessarily the actual selling or world price. Using the January 1974 CPI value of 46.6 and the January 2005 CPI value of 190.7, that $38.07 price translates to $155.80 per barrel today (and yes, for those of you that know about it, we're "supposed to" use the GDP deflator but in our opinion it's significantly less accurate than the CPI). A barrel is 42 gallons.
Oil Forecasting Legend Paints Dire Energy Picture, June 2005 longer term picture
World Oil Market and Oil Price Chronologies: 1970 - 2003
Quoted Pearls on Energy, a May 2005 broad recap
World Gasoline Prices, March 2005
The best "simple" chart we've ever seen showing where the energy comes from and where it goes, and how much is wasted.The source of the data and chart itself is within the chart. Although the data is from 2002, the relationships are still quite similar.
A joule is a measure of energy. 3.6 million joules are roughly equivalent to a kilowatt hour, and a kilowatt hour means 10 hours of burning a 100 watt light bulb. The exa- prefix is a quintillion (10^18), two steps beyond a trillion.