| Item | Rate | Notes |
|---|---|---|
| Federal personal income tax | 17% (2011 est. - 18.2%) |
Top 39.6% rate. Source |
| State & local income taxes | 10.1% (2012 - 9.9%) |
State taxes range from 6.5% to 12.6%. Local taxes run from zero to 2.75%. Source, source, source, 2012 source |
| Sales tax | 9.7% (2009 - 10.3%) |
Figure is the average rate. State sales taxes range up to 8% and local taxes run from zero to over 5%. In 2010, state and local collections averaged $925 per capita.Source, source, 2008 source (broken link as of 2012), 2009 source 2011 source |
| Social security & Medicare | 7.65% | Total rate is actually 15.3% since half is paid by the employer, but we're ignoring that to be kind and to avoid being accused of being too political. |
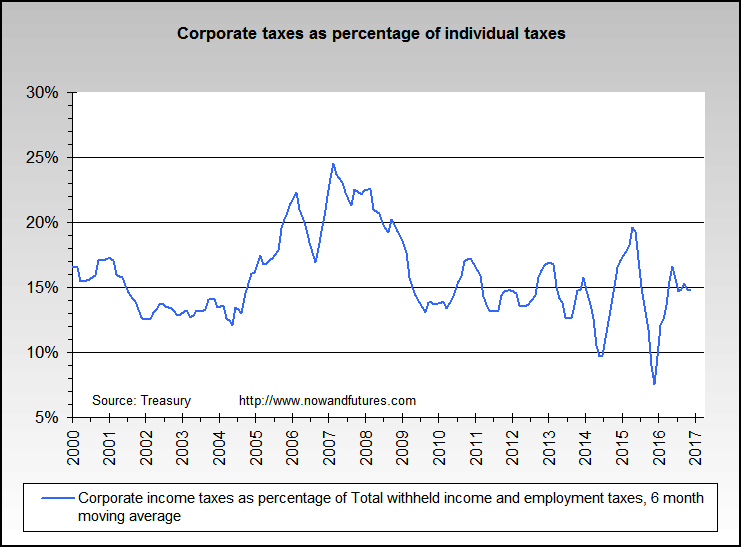
| Federal and state corporate income tax share | 2.5% | Based on corporate taxes being approximately 1/6 of personal taxes, and that they are paid by individuals in the final analysis. |
| Property tax | 2.5% (2011 - 2.8%) |
Yearly average actual costs range from under $200 in Alaska to almost $1900 in New Jersey. State and local property taxes in fiscal 2010 averaged $1424 per capita, with a low of $539 in Alabama to $2819 in New Jersey) per the Tax Foundation. Source |
| Fuel/gasoline tax | .5% (2009 est. - .6%) |
Approximately 23% of the 2005 gasoline price is for federal & state taxes. The federal excise tax is 18.4 cents per gallon. Per the CPI, about 6% of the average budget is for transportation. Estimated. 2010 estimate, $.45 per gallon average. As of January 1, 2013, the lowest rate was 8 cents per gallon in Alaska and the highest was 50.6 cents in New York per the Tax Foundation.Source |
| Other | 6%+ (2009-2013 - 8%+) |
Includes estate tax, fees, licenses, real inflation losses, inheritance, deficit allowance, gift, and others noted below. Estimated. |
![]()